Stocks moving sideways: Consolidation before the next leg up?

The S&P 500 continues to fluctuate following last week’s rally - what’s next?
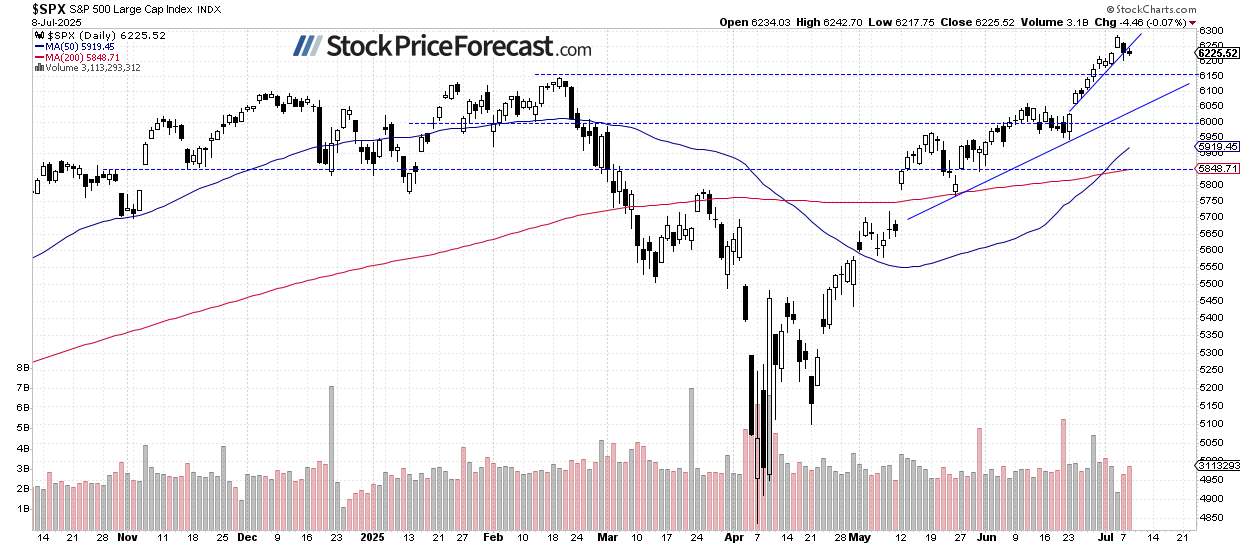
The S&P 500 Index closed 0.07% lower on Tuesday, essentially moving sideways after Monday’s pullback. The market remains mixed as investors digest recent tariff-related news and economic data. Today, the index is set to open 0.2% higher, according to futures contracts. The S&P 500 remains relatively close to Friday’s new record high of 6,284.65.
Investor sentiment has improved, as reflected in last Wednesday’s AAII Investor Sentiment Survey, which reported that 45.0% of individual investors are bullish, while 33.1% are bearish.
The index is trading above the 6,200 level, as the daily chart shows.
Nasdaq 100: Short-term consolidation
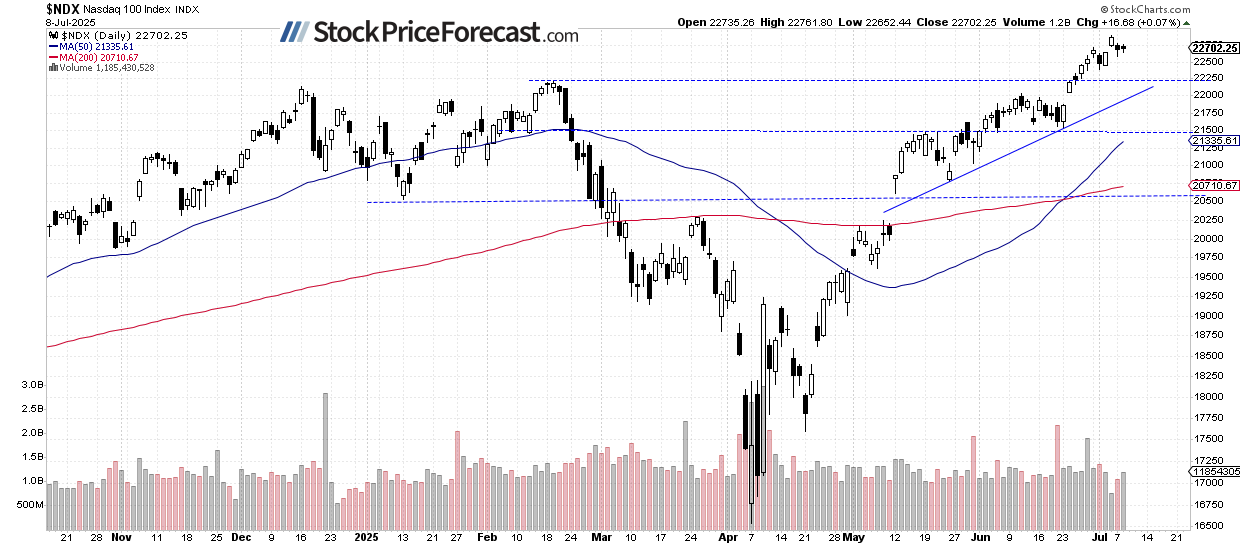
The Nasdaq 100 gained 0.07% on Tuesday, remaining within Monday’s trading range. After hitting a new all-time high of 22,896.01 on Friday, it pulled back to a low of 22,587.47 on Monday. This appears to be a brief correction, with no confirmed negative signals evident at this point.
VIX: No clear direction
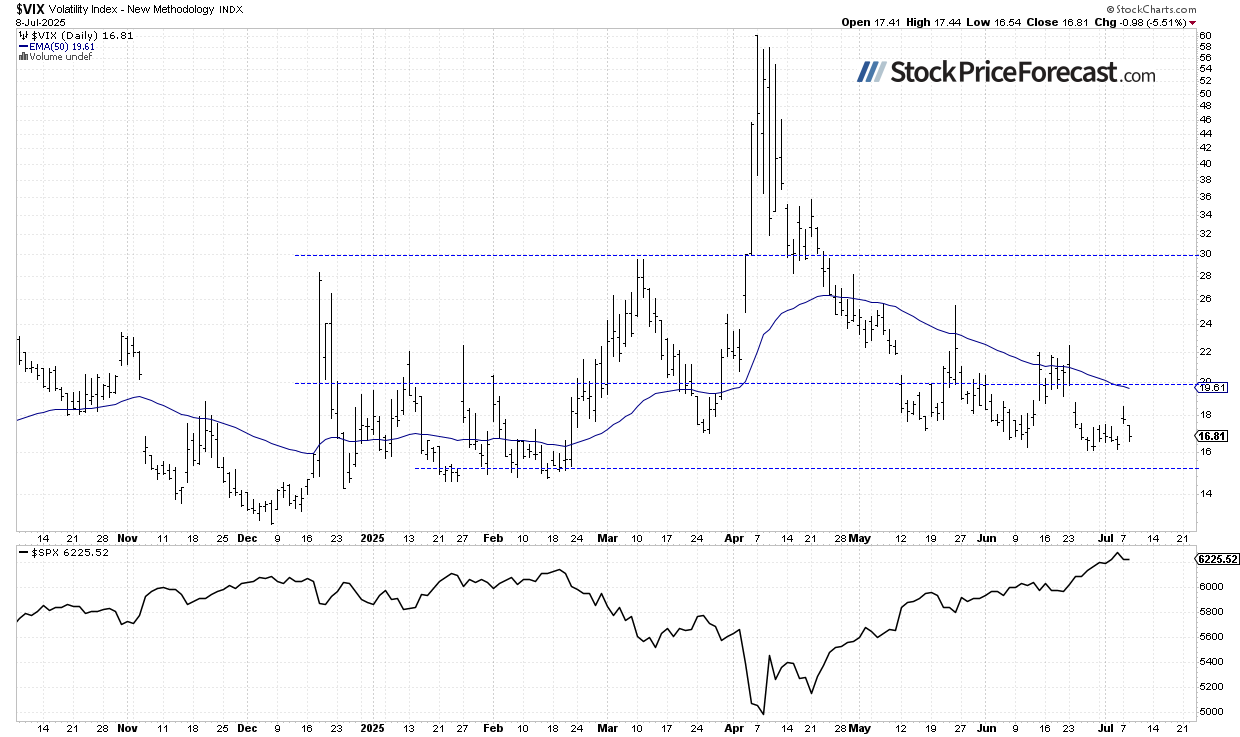
The Volatility Index (VIX) hit a local low of 16.11 on previous Thursday - the lowest since February 21 - reinforcing the strength of the equity rally and signaling calmer market conditions. However, despite continued stock market gains, it failed to make a new low last week. Volatility increased on Monday but pulled back again on Tuesday.
Historically, a dropping VIX indicates less fear in the market, and rising VIX accompanies stock market downturns. However, the lower the VIX, the higher the probability of the market’s downward reversal. Conversely, the higher the VIX, the higher the probability of the market’s upward reversal.
S&P 500 futures contract: Approaching 6,300 again
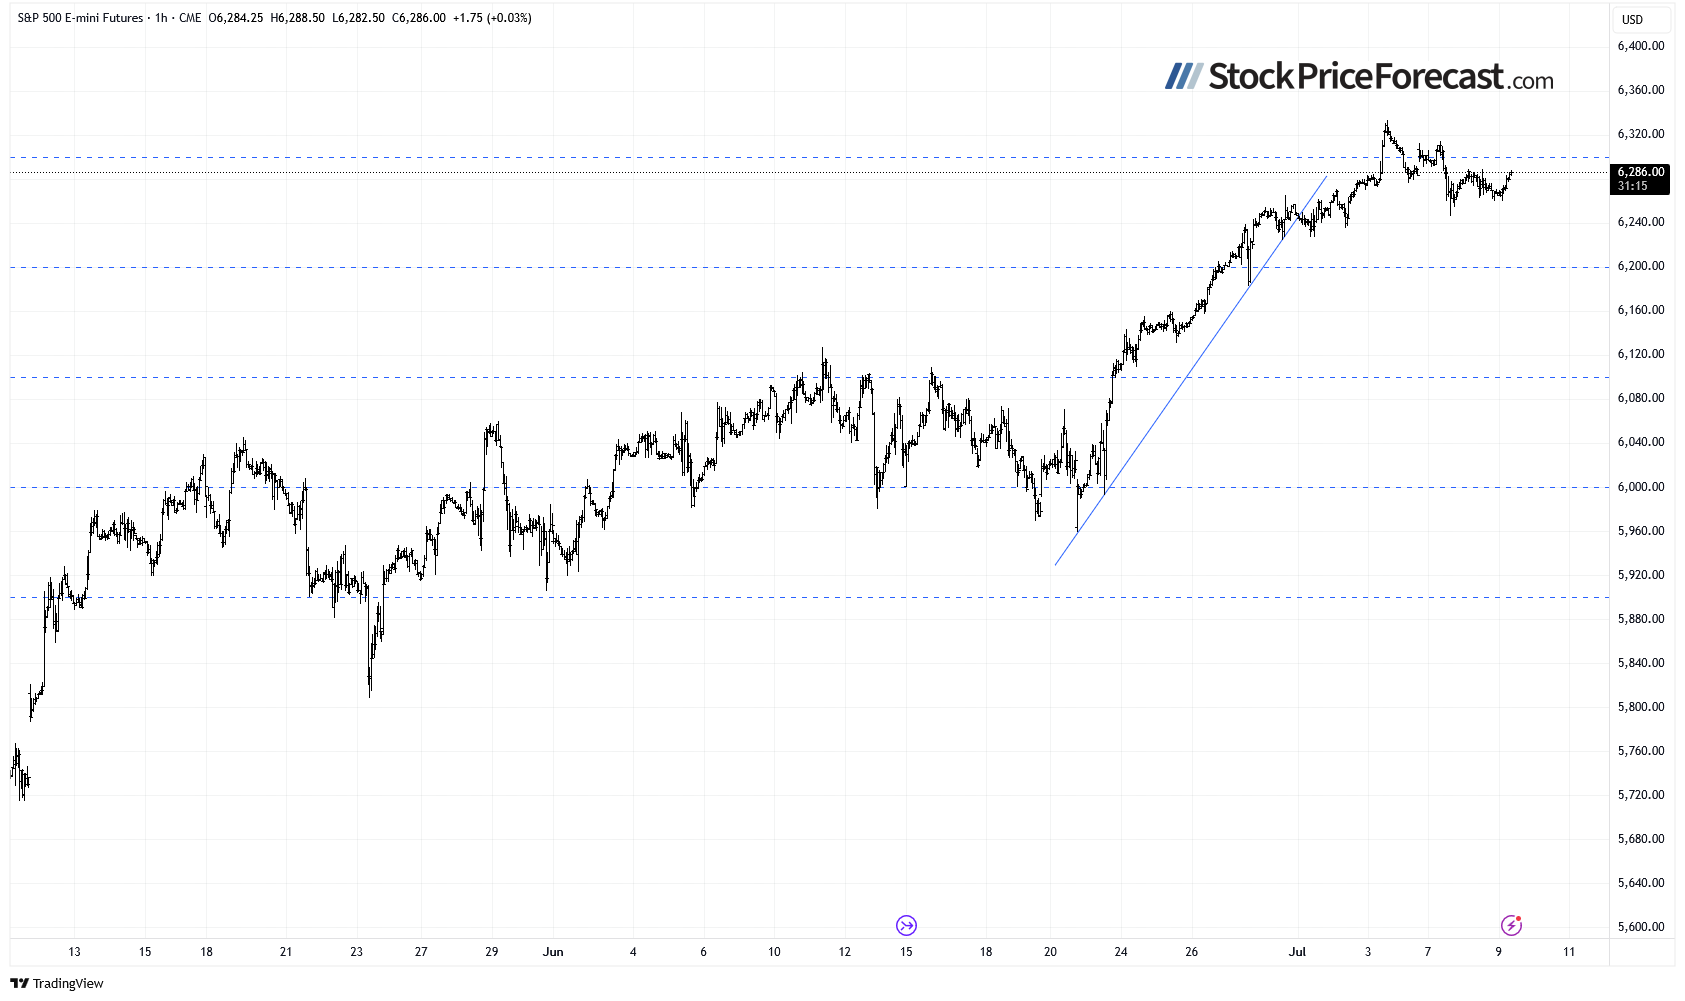
This morning, the S&P 500 futures contract is consolidating below the 6,300 level. Resistance remains in the 6,300–6,320 range, with support near 6,250.
Markets remain highly sensitive to geopolitical developments and could stay volatile in the near term.
Conclusion
Wednesday’s session is expected to open on a slightly positive note, with the S&P 500 index set to rise 0.2%. The index remains near its all-time high, and no clear bearish signals are currently present. However, a more pronounced round of profit-taking cannot be ruled out in the near term.
Last Tuesday, I noted “I think that in the short term, overbought technical conditions may lead to a period of consolidation or a mild pullback. However, no clear bearish signals are currently evident”. That outlook remains valid.
Here’s the breakdown
-
The S&P 500 continues to consolidate after pulling back to around 6,200 on Monday.
-
The recent rally extended gains for those who bought based on my Volatility Breakout System.
-
There are no clear bearish signals yet, but a deeper downward correction is not out of the question at some point.
Want free follow-ups to the above article and details not available to 99%+ investors? Sign up to our free newsletter today!
Want free follow-ups to the above article and details not available to 99%+ investors? Sign up to our free newsletter today!
Author

Paul Rejczak
Gold Price Forecast
Paul Rejczak is a stock market strategist who has been known for the quality of his technical and fundamental analysis since the late nineties.

















