Stocks: Is Friday’s sell-off the beginning of a downtrend?

The S&P 500 has sharply corrected its recent advances – is it poised for more downside?
Volatility breakout system update
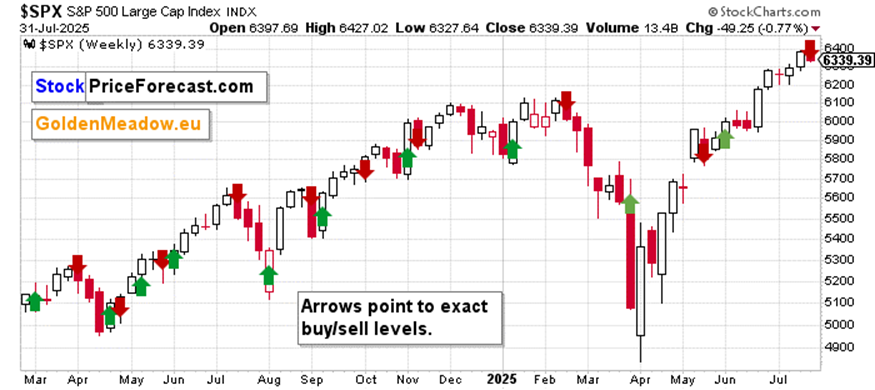
My Volatility Breakout System reversed to a short position on Thursday, as the S&P 500 hit the sell trigger at 6,328.27. The strategy gained 363.94 points on its long position since June 3. That's yet another successful trade facilitated by my Volatility Breakout System. Additionally, the short position from Thursday is showing a 90-point gain.
This systematic approach continues to identify key market turning points and has been particularly effective during this year's volatile conditions, outperforming S&P 500!
The system's strength lies in its ability to capture major market moves while avoiding the noise of day-to-day fluctuations. For those following this approach, the current position demonstrates how patience and systematic execution can lead to meaningful gains.
S&P 500 sells off sharply
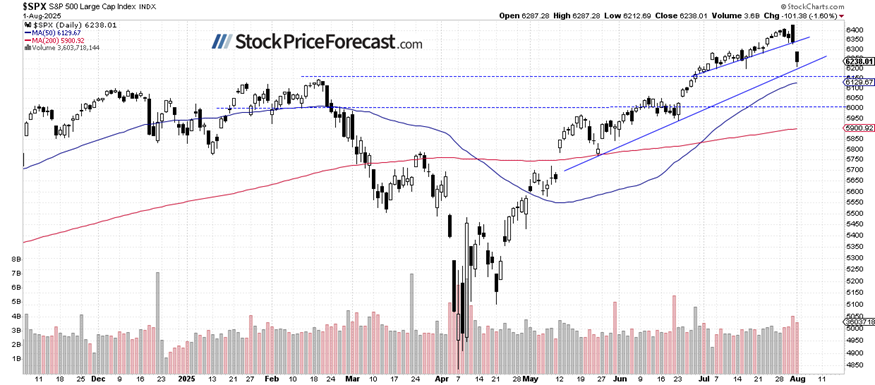
Stocks sold off on Friday, with the S&P 500 index closing 1.60% lower, retracing weeks of recent gains and dipping to a local low of 6,212.69. On Thursday, the index pulled back from a new record high of 6,427.02, so in just two days it fell 214.3 points, or 3.33%. Today, the market is set to open about 0.5% higher, rebounding after this two-day decline.
Recently, the investor sentiment has improved slightly, as reflected last Wednesday’s AAII Investor Sentiment Survey, which reported that 40.3% of individual investors are bullish, while 33.0% are bearish.
The S&P 500 closed Friday at its lowest level since early July, as shown on the daily chart.
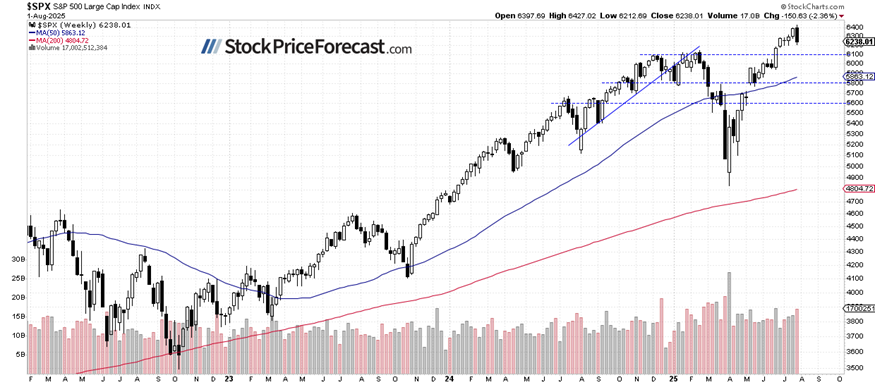
Weekly chart: S&P 500 Pulls back
Last week, the S&P 500 lost 2.36% after gaining 1.5% in the prior week. For now, this appears to be a consolidation following the advance from April lows; however, a deeper correction remains possible.
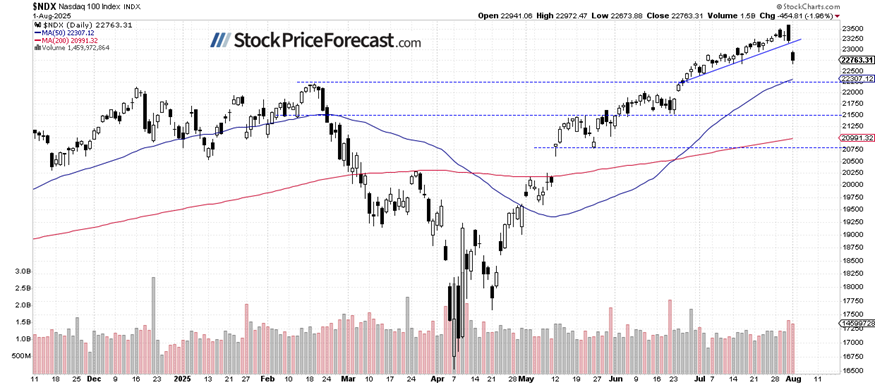
Nasdaq 100 drops below 23,000
The Nasdaq 100 closed 1.96% lower on Friday, dragged down by declines in Apple, Amazon, and Nvidia. A potential support level lies around 22,300, marked by the February high.
While there are no strong bearish signals yet, the recent price action may be forming a potential topping pattern.
Volatility spikes
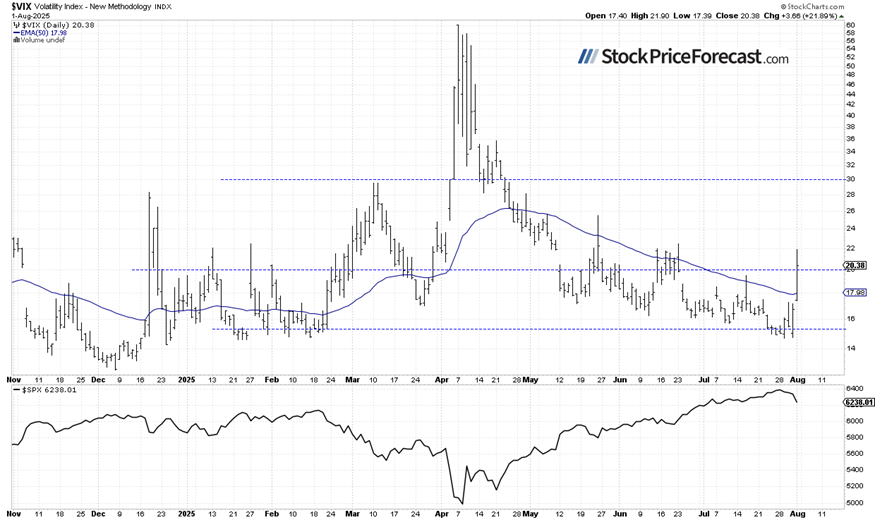
Friday’s sell-off pushed the VIX (Volatility Index) to 21.90, its highest level since June 23.
Recently, the decline in VIX reflected declining investor fear (declining gold prices indicate the same thing).
Historically, a dropping VIX indicates less fear in the market, and rising VIX accompanies stock market downturns. However, the lower the VIX, the higher the probability of the market’s downward reversal. Conversely, the higher the VIX, the higher the probability of the market’s upward reversal.
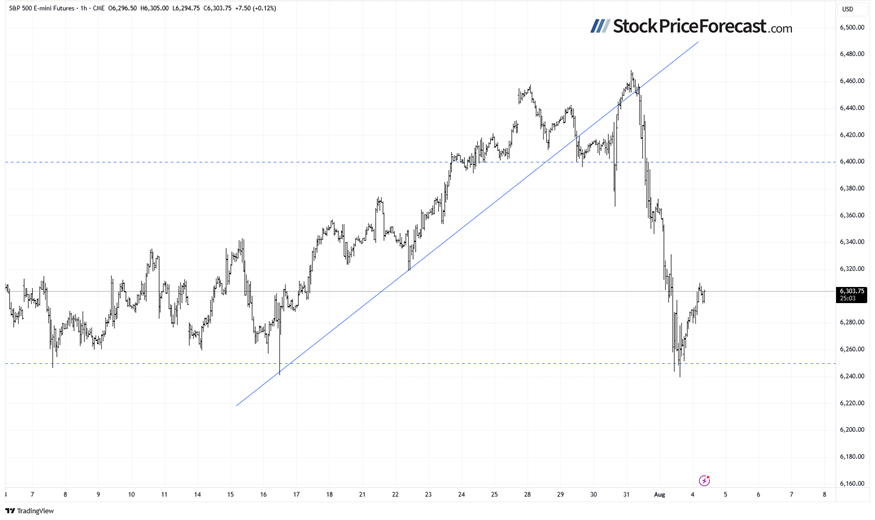
S&P 500 futures contract: Rebound toward 6,300
This morning, the S&P 500 futures contract trading near 6,300 after bouncing from Friday’s low of around 6,240. Resistance is at 6,330, with support at 6,280.
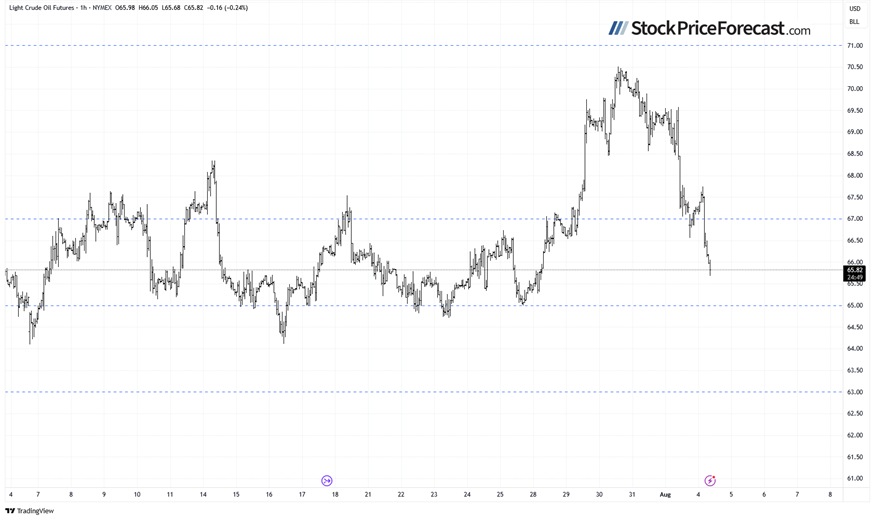
Crude Oil declines following stocks, OPEC+ news
Crude oil dropped 2.79% on Friday as tariff-related uncertainty and the stock market sell-off hit sentiment. Today, oil is down another 2.1% after OPEC+ announced further production hikes over the weekend.
As I'm writing in my Oil Trading Alerts, key developments worth monitoring include:
-
OPEC+ agreed to raise September output by 547,000 bpd, marking the sixth straight monthly increase and a full reversal of major supply cuts. Analysts warn higher supply could pressure prices, though potential U.S. sanctions on Russian oil may offset the surplus.
-
The U.S. has threatened 100% secondary tariffs on countries like India and China if they keep buying Russian crude, putting ~1.7 million bpd at risk. If buyers pull back, it could erase expected supply surpluses and give OPEC+ room to unwind further cuts.
-
Softer jobs numbers, weak PMI data, and uncertainty from new U.S. trade tariffs are fueling concerns over slowing fuel demand. Goldman Sachs forecasts Brent at $64 in Q4 2025 but warns both geopolitical risks and demand weakness could shift the outlook.
Market outlook: Correction may not be short-lived
The S&P 500 will likely start Monday higher, rebounding after Friday’s sharp drop. I see this as either a short-term bounce within a broader consolidation or a temporary advance in a potential downtrend.
This week’s focus will be on earnings, with Palantir reporting after today’s close and AMD tomorrow.
Here's what I think is most likely:
-
The S&P 500 has sharply reversed to the downside last week, declining by more than 3% from its Thursday high.
-
My Volatility Breakout System captured gains and flipped short on Thursday.
-
Active trades in XLF (short) and TSLA (long) remain in place.
What this means for your portfolio
For individual investors, this environment calls for careful position management. While the market continues to advance, the combination of low volatility, seasonal weakness signals, and stretched valuations suggests that defensive positioning may become increasingly important in the weeks ahead.
Want free follow-ups to the above article and details not available to 99%+ investors? Sign up to our free newsletter today!
Want free follow-ups to the above article and details not available to 99%+ investors? Sign up to our free newsletter today!
Author

Paul Rejczak
Gold Price Forecast
Paul Rejczak is a stock market strategist who has been known for the quality of his technical and fundamental analysis since the late nineties.


