Stocks: Have we reached the top?

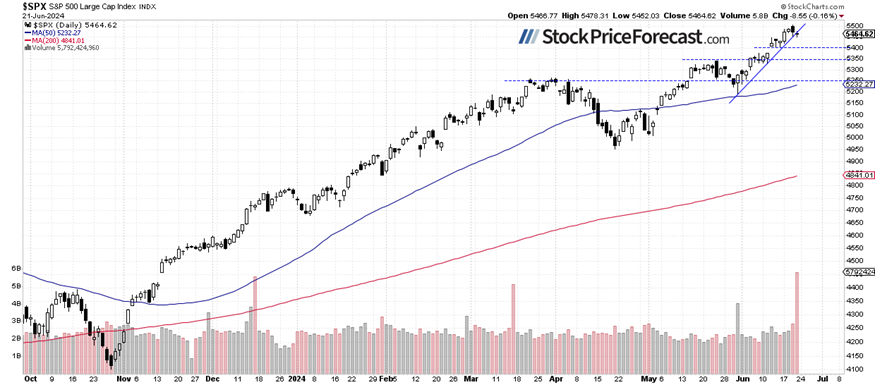
Friday’s trading session didn’t bring much change for the stock market, with the S&P 500 index closing 0.16% lower. It fluctuated following its Thursday retreat from a new record high of 5,505.53. Today, the index is likely to open virtually flat, further extending a short-term consolidation.
In my forecast for June, I wrote “For the last three months, the S&P 500 index has been fluctuating along new record highs, above the 5,000 level which was broken in February. It looks like a consolidation within a long-term uptrend, but it may also be a topping pattern before some meaningful medium-term correction. What is it likely to do? As the saying goes, 'the trend is your friend', so the most likely scenario is more advances in the future.
However, a negative signal would be a breakdown below the 5,000 level. That would raise the question of a deeper correction and downward reversal. I think that the likelihood of a bullish scenario is 60/40 - a downward reversal cannot be completely ruled out. The market will be waiting for more signals from the Fed about potential interest rate easing, plus, at the end of the month, the coming earnings season may dictate the market moves.”
Investor sentiment remained rather unchanged, as indicated by the AAII Investor Sentiment Survey last Wednesday, which showed that 44.4% of individual investors are bullish, while 22.5% of them are bearish (down from last week's reading of 25.7%). The AAII sentiment is a contrary indicator in the sense that highly bullish readings may suggest excessive complacency and a lack of fear in the market. Conversely, bearish readings are favorable for market upturns.
The S&P 500 index broke its upward trend line on Friday, as we can see on the daily chart.
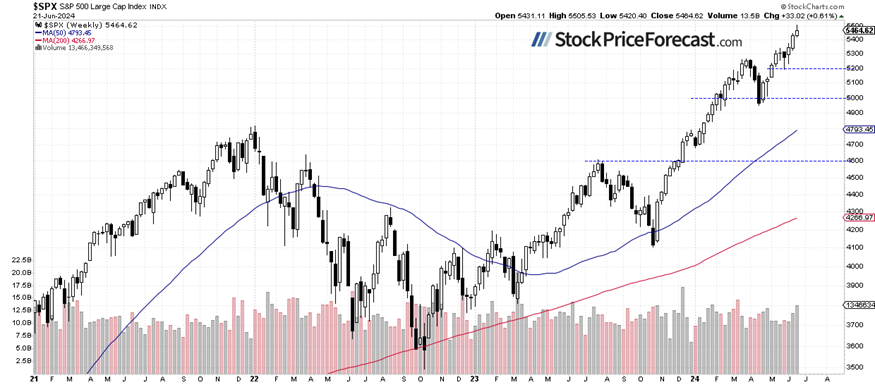
S&P 500 extended its bull market last week
Compared to the previous Friday’s closing price, the index gained 0.61%, reaching a new record high and extending its long-term uptrend on Friday. However, Friday’s retreat is likely to mark a short-term local high, and a consolidation or correction may follow.
Quoting an article from May 13: “The recent price action confirmed the importance of the 5,000 level as a medium-term support. It’s hard to say whether the market will continue its long-term uptrend; however, it will most likely remain above 5,000 in the coming weeks or months.”
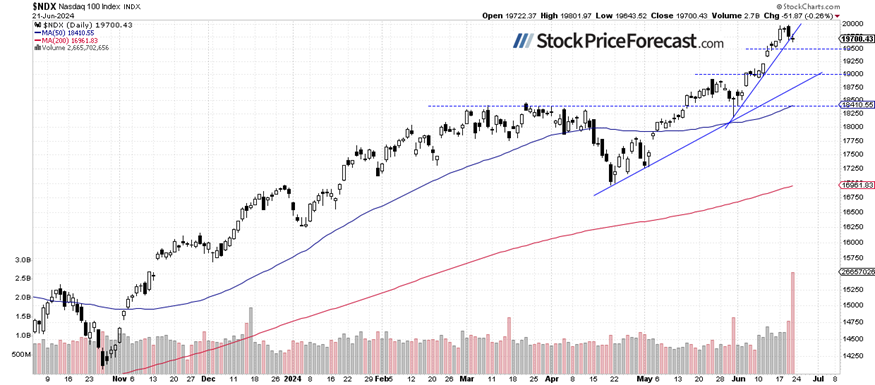
Nasdaq 100 remained below 20,000
The technology-focused Nasdaq 100 index reached a new record high of 19,979.93 on Thursday, before retracing some of the recent advances. On Friday, it went sideways despite economic data and “quadruple witching” derivatives expiration.
Is this a top? For now, it looks like a correction; however, a breakdown below 19,500 would likely increase selling pressure. This morning, the Nasdaq 100 is likely to open 0.1% lower.
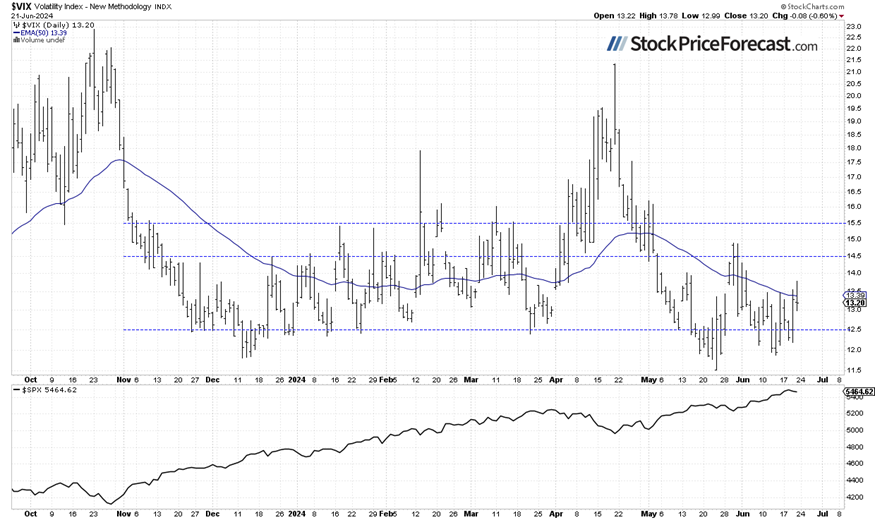
VIX remained above 13
The VIX index, also known as the fear gauge, is derived from option prices. In late May, it set a new medium-term low of 11.52 before rebounding up to around 15 on correction worries. Recently, the VIX came back towards 12, and on Thursday and on Friday, it closed above 13, showing increasing fear in the market.
Historically, a dropping VIX indicates less fear in the market, and rising VIX accompanies stock market downturns. However, the lower the VIX, the higher the probability of the market’s downward reversal.
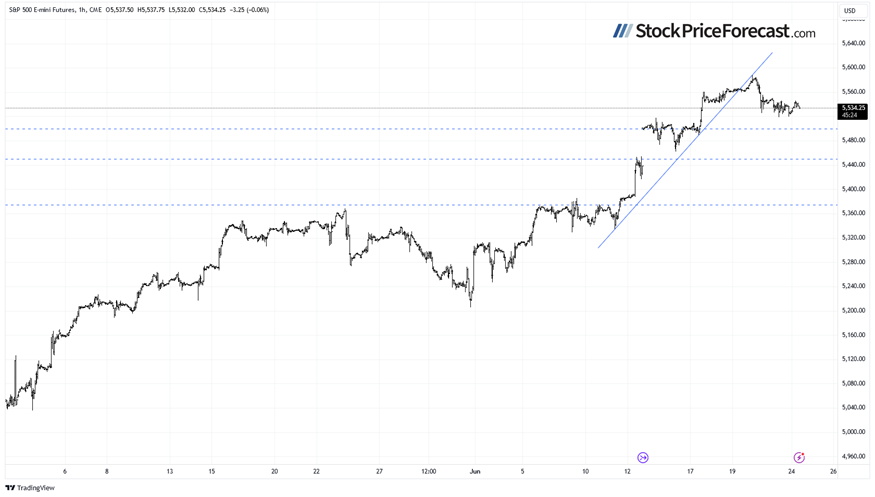
Futures contract going sideways
Let’s take a look at the hourly chart of the S&P 500 futures contract. On Thursday, it reached a new high of around 5,588, and on Friday, it was trading along the 5,530 level. This morning, it keeps going sideways, with resistance at 5,550 and support at 5,520.
Conclusion
The S&P 500 index is likely to open flat this morning, as indicated by futures contracts. Has the uptrend reversed last Thursday? For now, it’s a consolidation following Thursday’s retreat. It seems that the market may go sideways for some time. Investors will be waiting for economic data this week: tomorrow, the CB Consumer Confidence release, the GDP on Thursday, and the important Core PCE Price Index on Friday.
For now, my short-term outlook remains neutral.
Here’s the breakdown:
-
The S&P 500 reversed lower from a new record high on Thursday; for now, it’s a downward correction.
-
Recently, stock prices were reaching new record highs despite mixed data and growing uncertainty.
-
In my opinion, the short-term outlook is neutral.
Want free follow-ups to the above article and details not available to 99%+ investors? Sign up to our free newsletter today!
Want free follow-ups to the above article and details not available to 99%+ investors? Sign up to our free newsletter today!
Author

Paul Rejczak
Sunshine Profits
Paul Rejczak is a stock market strategist who has been known for the quality of his technical and fundamental analysis since the late nineties.


