Stocks: Can the record-breaking rally last?

The S&P 500 is poised to hit new records after earnings releases, but is there any upside left?
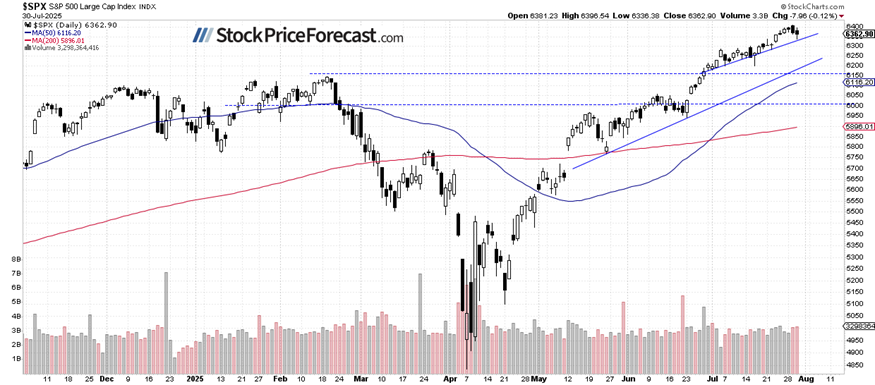
Stocks extended their pullback on Wednesday, as hawkish comments from Fed Chair Jerome Powell triggered profit-taking. Ultimately, the S&P 500 closed 0.12% lower after rebounding from a local low near 6,336. After the close, earnings from Meta and Microsoft fueled strong gains, and the index is expected to open 0.9% higher this morning, reaching new records above 6,400.
Investor sentiment has improved slightly, as reflected in yesterday’s AAII Investor Sentiment Survey, which reported that 40.3% of individual investors are bullish, while 33.0% are bearish.
The S&P 500 pulled back from Tuesday’s record, as we can see on the daily chart.
Nasdaq 100 – New records expected
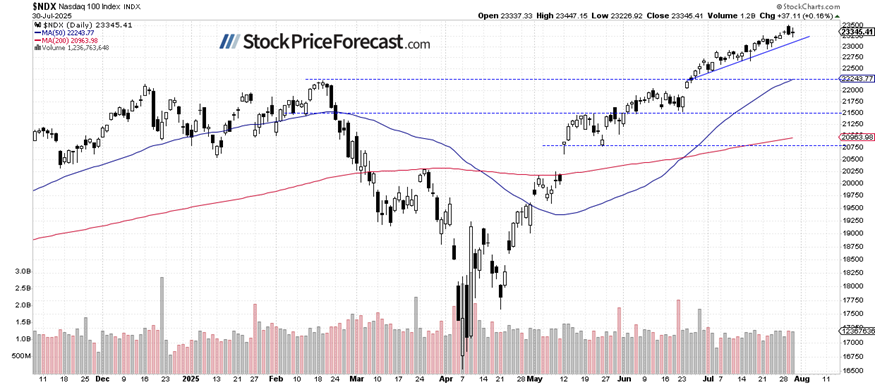
The Nasdaq 100 closed 0.16% higher on Wednesday and is expected to open 1.3% higher this morning, reaching a new all-time high. Investors have recently been heavily favoring AI-related stocks, and the rally increasingly resembles a frenzy, with prices drifting further from fundamentals. Yesterday’s earnings from Meta and Microsoft are likely to add fuel to this euphoria.
While there are no strong bearish signals yet, the recent price action may be forming a potential topping pattern.
Volatility fluctuates
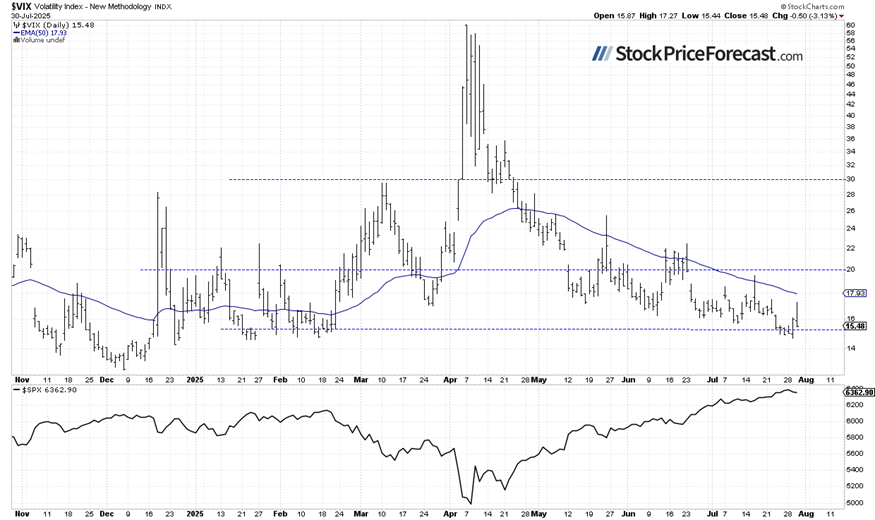
The VIX (Volatility Index) fell to a local low of 14.70 on Tuesday before rebounding to 17.3 and then pulling back.
The decline in VIX reflected declining investor fear (declining gold prices indicate the same thing), but the sharp reversal may signal a short-term market top.
Historically, a dropping VIX indicates less fear in the market, and rising VIX accompanies stock market downturns. However, the lower the VIX, the higher the probability of the market’s downward reversal. Conversely, the higher the VIX, the higher the probability of the market’s upward reversal.
Volatility breakout system update
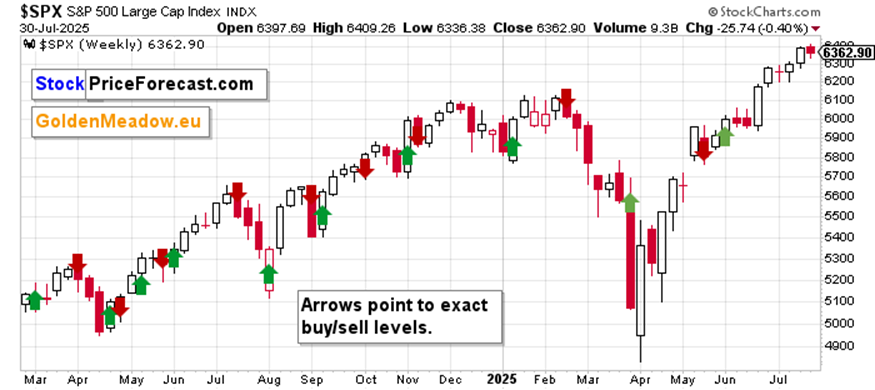
My Volatility Breakout System remains long on the S&P 500 index since June 3, 2025, at 5,964.33 - currently showing a solid profit. These gains appear likely to continue despite short-term pullbacks. This systematic approach continues to identify key market turning points and has been particularly effective during this year's volatile conditions, outperforming S&P 500!
The system's strength lies in its ability to capture major market moves while avoiding the noise of day-to-day fluctuations. For those following this approach, the current position demonstrates how patience and systematic execution can lead to meaningful gains.
Seasonal trading signal suggests caution
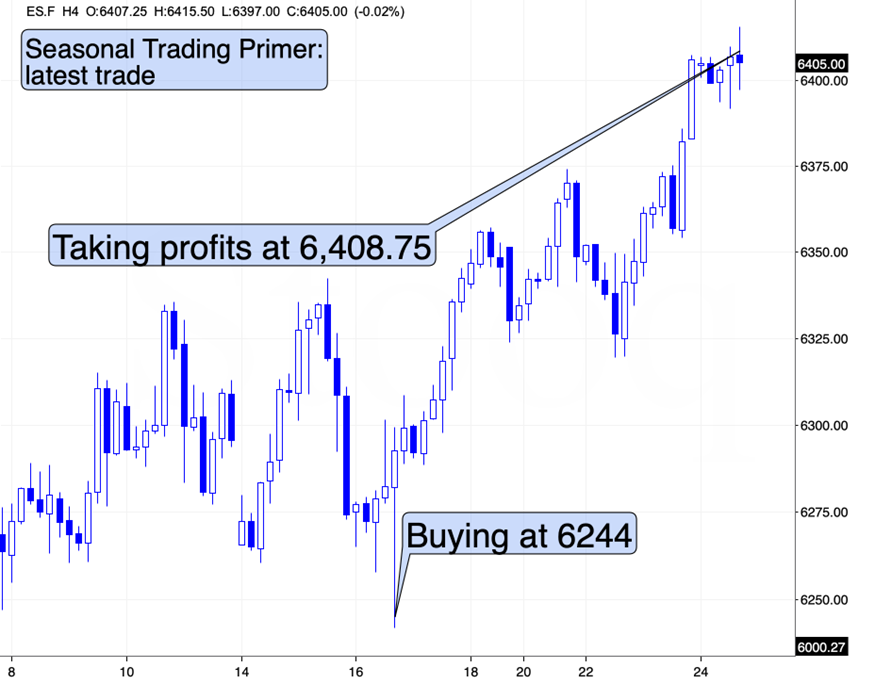
One important warning signal comes from Ryan Mitchell's Seasonal Trading Primer, which suggests that the market may be nearing the end of its short-term seasonal strength.
S&P 500 futures contract hit new records
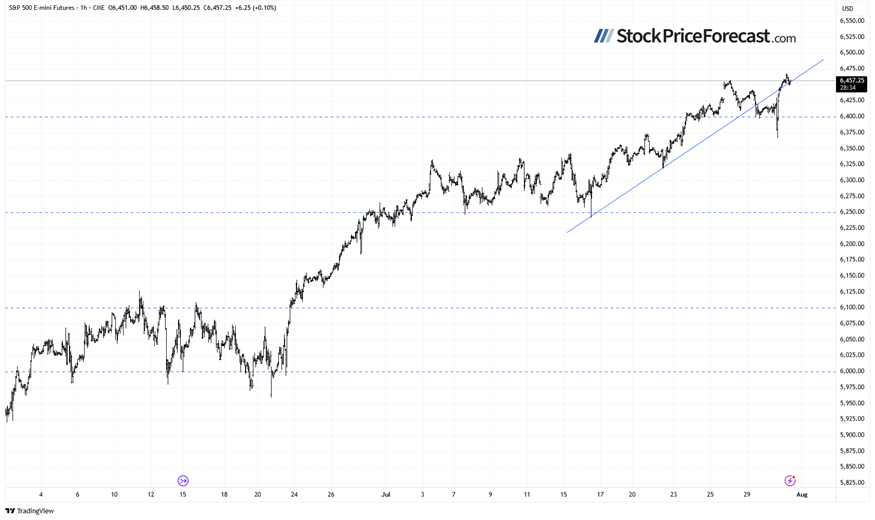
This morning, the S&P 500 futures contract is trading near a record 6,469, driven by Meta and Microsoft earnings. Resistance is near 6,460, with support around 6,400. While no clear negative signals are present, the market remains in a potential topping pattern and is highly sensitive to tariff-related news.
Crude Oil hovers around $70
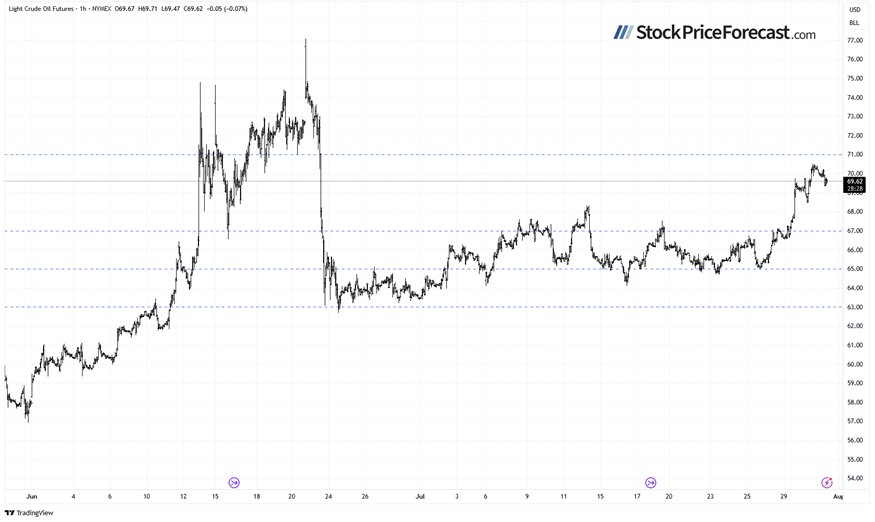
Crude oil closed 1.14% higher on Wednesday, continuing its uptrend amid positive sentiment, supply concerns, and tariff headlines. Today, it is down 0.5% after pulling back from its local high above $70.
As I'm writing in my Oil Trading Alerts, key developments worth monitoring include:
-
Trump warned Russia and its oil buyers, particularly China, of 100% secondary tariffs if the Ukraine war does not progress toward resolution within 10–12 days. The U.S. also tightened sanctions on Iran-linked entities after June’s strikes on nuclear facilities.
-
Analysts in a Reuters poll expect Brent crude to average $67.84 in 2025 and WTI $64.61, largely unchanged from prior forecasts. They anticipate prices drifting lower into 2026, with Brent averaging about $62.98 in Q2.
-
Ongoing U.S. tariff uncertainty and rising OPEC+ output continue to weigh on the market. Eight OPEC+ members are set to increase production by 548,000 bpd in August, with a similar rise likely in September.
Market outlook: Earnings are driving stocks higher
The S&P 500 is poised to reach a new record high this morning after a brief pullback on Tuesday and Wednesday. Sentiment is elevated, and some profit-taking is likely in the near term. While no confirmed negative signals are visible, the risk-to-reward ratio for new long positions is less favorable.
Here's what I think is most likely:
-
The S&P 500 is likely to set a new all-time high today.
-
The rally has extended gains for those using systematic approaches like my Volatility Breakout System.
-
There are no clear bearish signals yet, but a deeper downward correction is not out of the question at some point.
-
A lack of strong bullish catalysts may limit further upside in the near term.
What this means for your portfolio
For individual investors, this environment calls for careful position management. While the market continues to advance, the combination of low volatility, seasonal weakness signals, and stretched valuations suggests that defensive positioning may become increasingly important in the weeks ahead.
The current market conditions highlight the value of having a systematic approach to investing rather than trying to time every market move. Whether you're using technical systems like the Volatility Breakout System or following seasonal patterns, having a disciplined framework becomes crucial during uncertain times.
Want free follow-ups to the above article and details not available to 99%+ investors? Sign up to our free newsletter today!
Want free follow-ups to the above article and details not available to 99%+ investors? Sign up to our free newsletter today!
Author

Paul Rejczak
Gold Price Forecast
Paul Rejczak is a stock market strategist who has been known for the quality of his technical and fundamental analysis since the late nineties.

















