Stocks: Are we already in a bear market?

The stock market suffered significant declines on Thursday and Friday, and this morning, expectations are very negative after an overnight sell-off in global markets, fueled by turmoil in the Yen and a crash in the Japanese Nikkei index. The S&P 500 index is likely to open 4.6% lower, extending its Friday decline of 1.84%.
Investor sentiment improved slightly this week, as indicated by the Wednesday’s AAII Investor Sentiment Survey, which showed that 44.9% of individual investors are bullish, while only 25.2% of them are bearish – down from 31.7% last week.
The S&P 500 index broke below its recent trading range on Friday, as we can see on the daily chart.
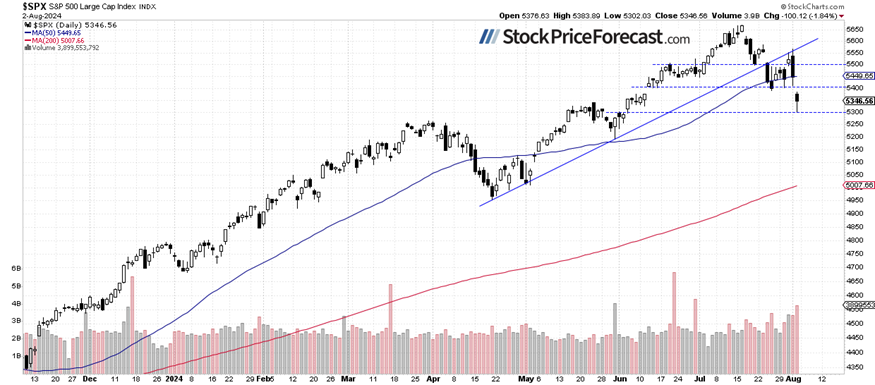
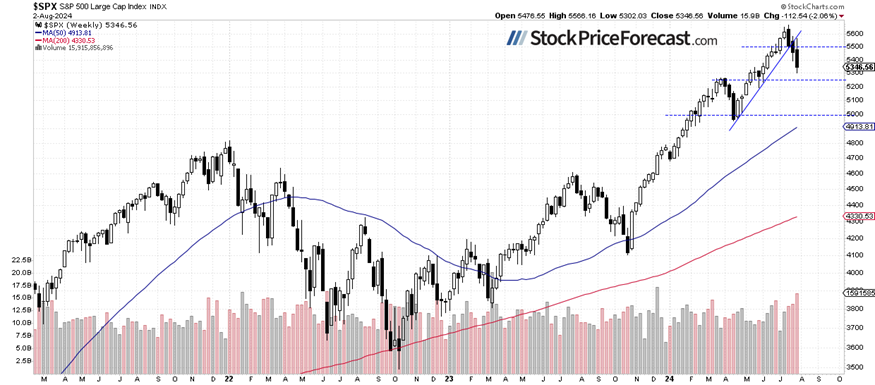
S&P 500 lost over 2% last week
Compared to the previous Friday’s closing price, the index lost 2.06%, extending its previous weeks' declines.
On July 15, I wrote that “there are signs that the market is getting ready for a correction or a consolidation” and it proved correct. The index broke below its months-long upward trend line.
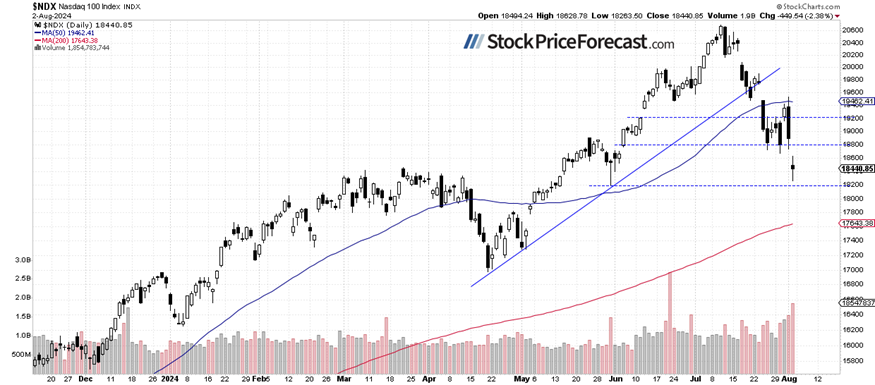
Nasdaq 100 extending declines
The technology-focused Nasdaq 100 lost 2.38% on Friday, and this morning, it’s likely to open 6.0% lower. It remains relatively weaker than the broader market, driven by sell-offs in FANG stocks.
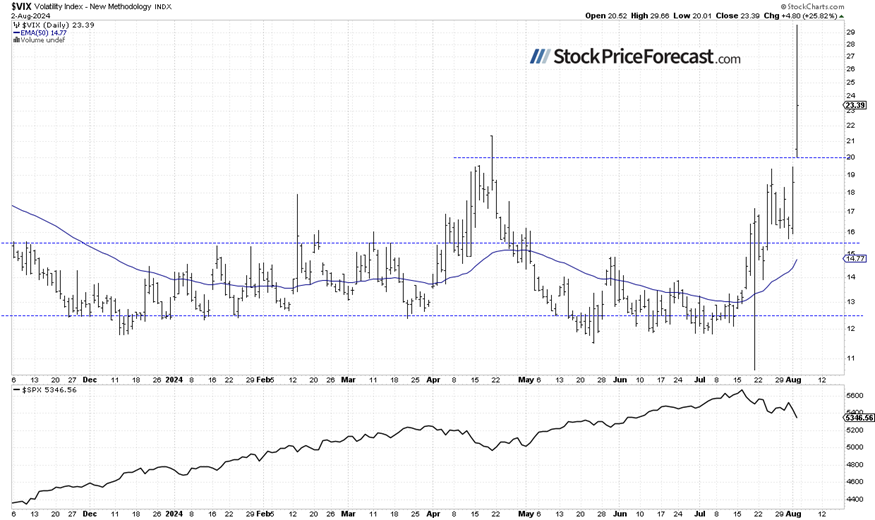
VIX neared 30 on Friday
The VIX index, a measure of market fear, accelerated its advance on Friday, nearing 30. This reflects significant fear in the market.
Historically, a dropping VIX indicates less fear in the market, and rising VIX accompanies stock market downturns. However, the lower the VIX, the higher the probability of the market’s downward reversal. Conversely, the higher the VIX, the higher the probability of the market’s upward reversal.
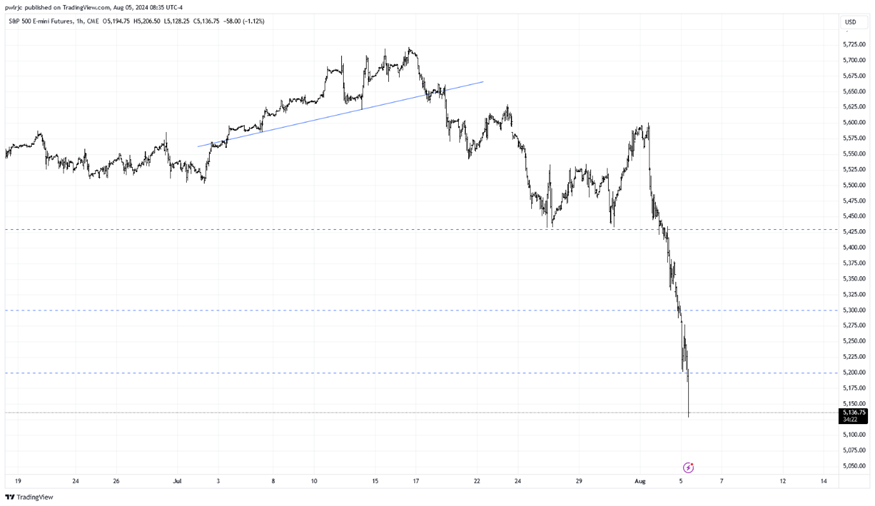
Futures contract: Selling off
Let’s take a look at the hourly chart of the S&P 500 futures contract. It reversed sharply lower on Thursday after reaching a local high of around 5,601. On Friday, it reached a local low of around 5,331, and this morning, it’s trading well below 5,200. Is it getting closer to capitulation and a short-term bottom? Most likely, though no positive signals are evident so far.
Conclusion
In my Stock Price Forecast for August on Friday, I noted “a sharp reversal occurred, and by the end of the month, the S&P 500 experienced significant volatility following the sell-off. August is beginning on a very bearish note, but the market may find a local bottom at some point.”
This morning, the S&P 500 is likely to open almost 5% lower, accelerating the downtrend amid Yen turmoil global stock markets rout. The market may be getting closer to a short-term bottom, but, of course, no positive signals are evident.
My short-term outlook is now neutral.
Here’s the breakdown:
-
The S&P 500 index is likely to accelerate the sell-off amid Yen turmoil and a global stock market rout.
-
The market may find a short-term bottom at some point.
-
In my opinion, the short-term outlook is neutral.
Want free follow-ups to the above article and details not available to 99%+ investors? Sign up to our free newsletter today!
Want free follow-ups to the above article and details not available to 99%+ investors? Sign up to our free newsletter today!
Author

Paul Rejczak
Sunshine Profits
Paul Rejczak is a stock market strategist who has been known for the quality of his technical and fundamental analysis since the late nineties.


