Start of something big or just a temporary pause? [Video]
![Start of something big or just a temporary pause? [Video]](https://editorial.fxstreet.com/images/Markets/Equities/market-analyze-18914145_XtraLarge.jpg)
Watch the video extracted from the WLGC session before the market open on 9 Jan 2024 below to find out the following:
-
How the change of character bar signals potential shifts in market dynamics.
-
Identify and interpret shortening thrusts to spot a potential reversal.
-
Judge the market health by the magnitude of pullbacks, supply levels, and consolidation characteristics.
-
Analyzing the demand zones in a chart and how they can act as crucial support levels.
-
And a lot more…
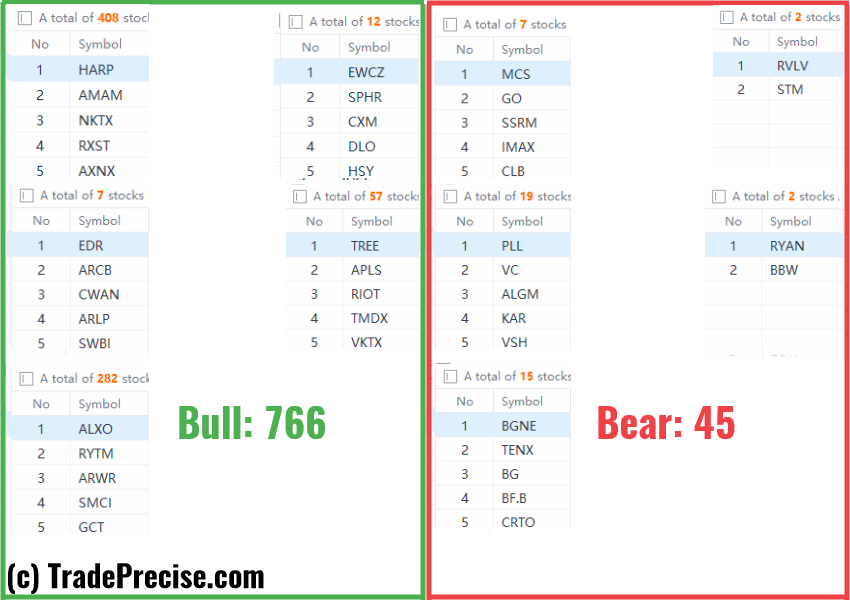
The bullish vs. bearish setup is 766 to 45 from the screenshot of my stock screener below pointing to a healthy and positive market environment.
The localised topping formation might be unfolding as per the tweet below:
"This is very bullish momentum $SPX $ES #SP500 and it will take a process like a localized topping formation, similar to the localized stopping process as shown in the video in order to stop the whole trend and then come to a pullback."
8 “low-hanging fruits” (OC, BLDR, etc…) trade entries setup + 21 others (ELF etc…) plus 5 “wait and hold” candidates have been discussed during the live session before the market open (BMO).
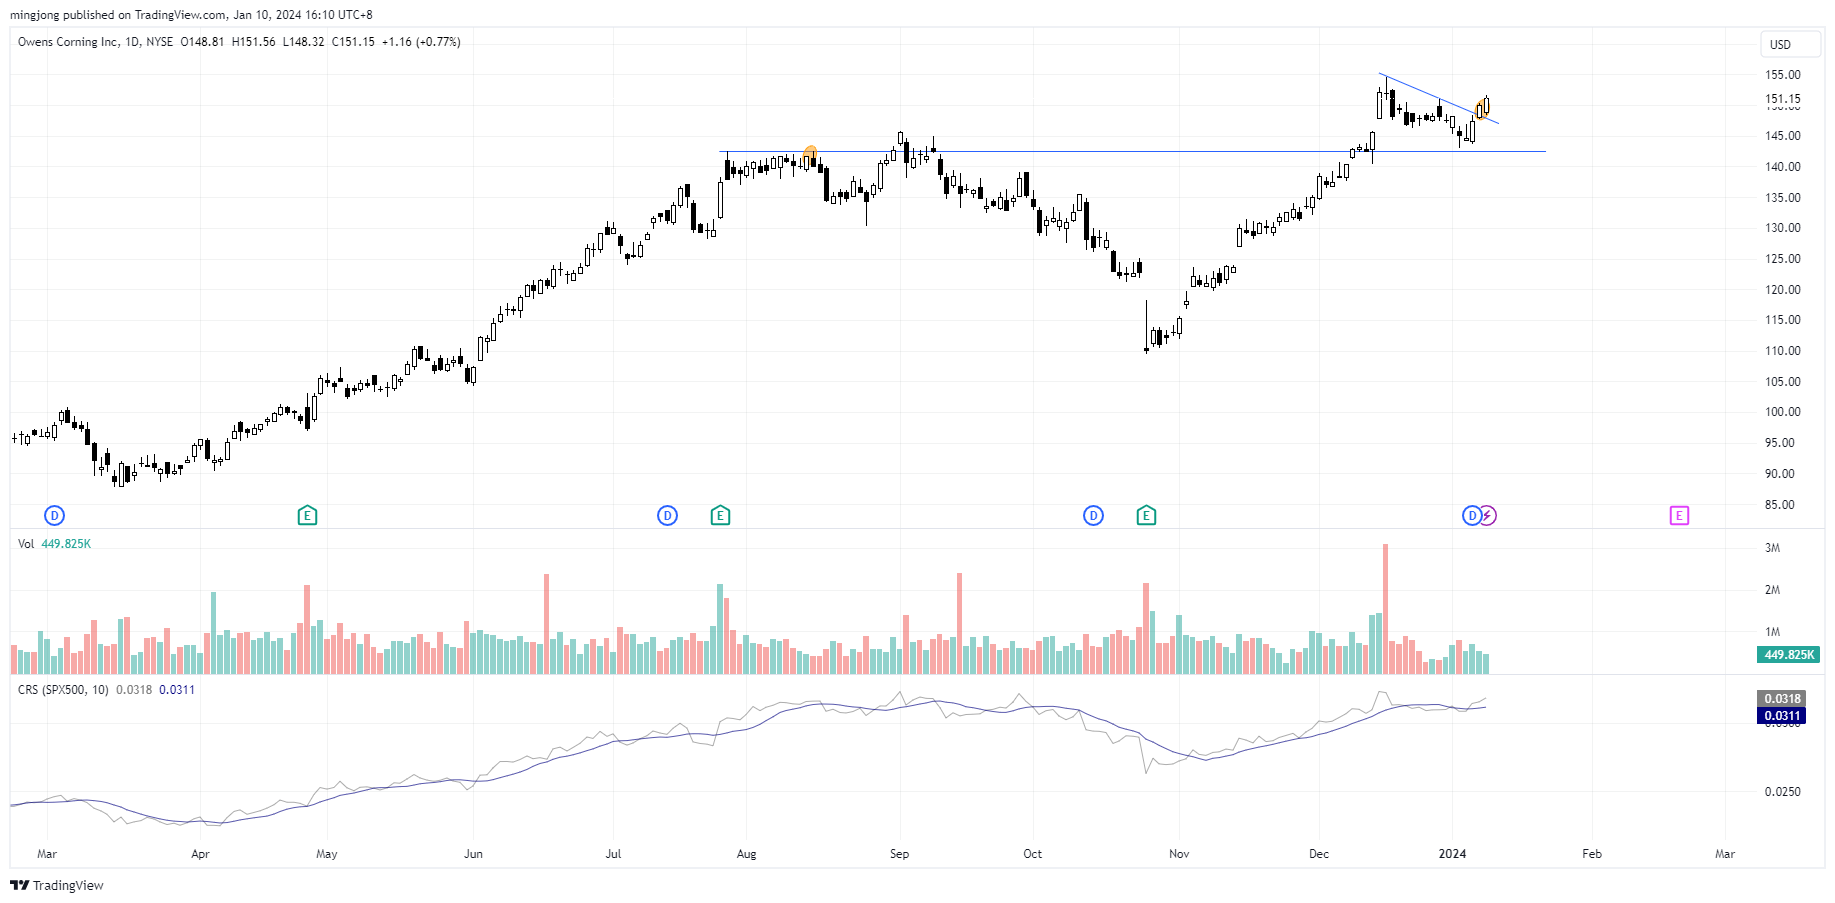
OC
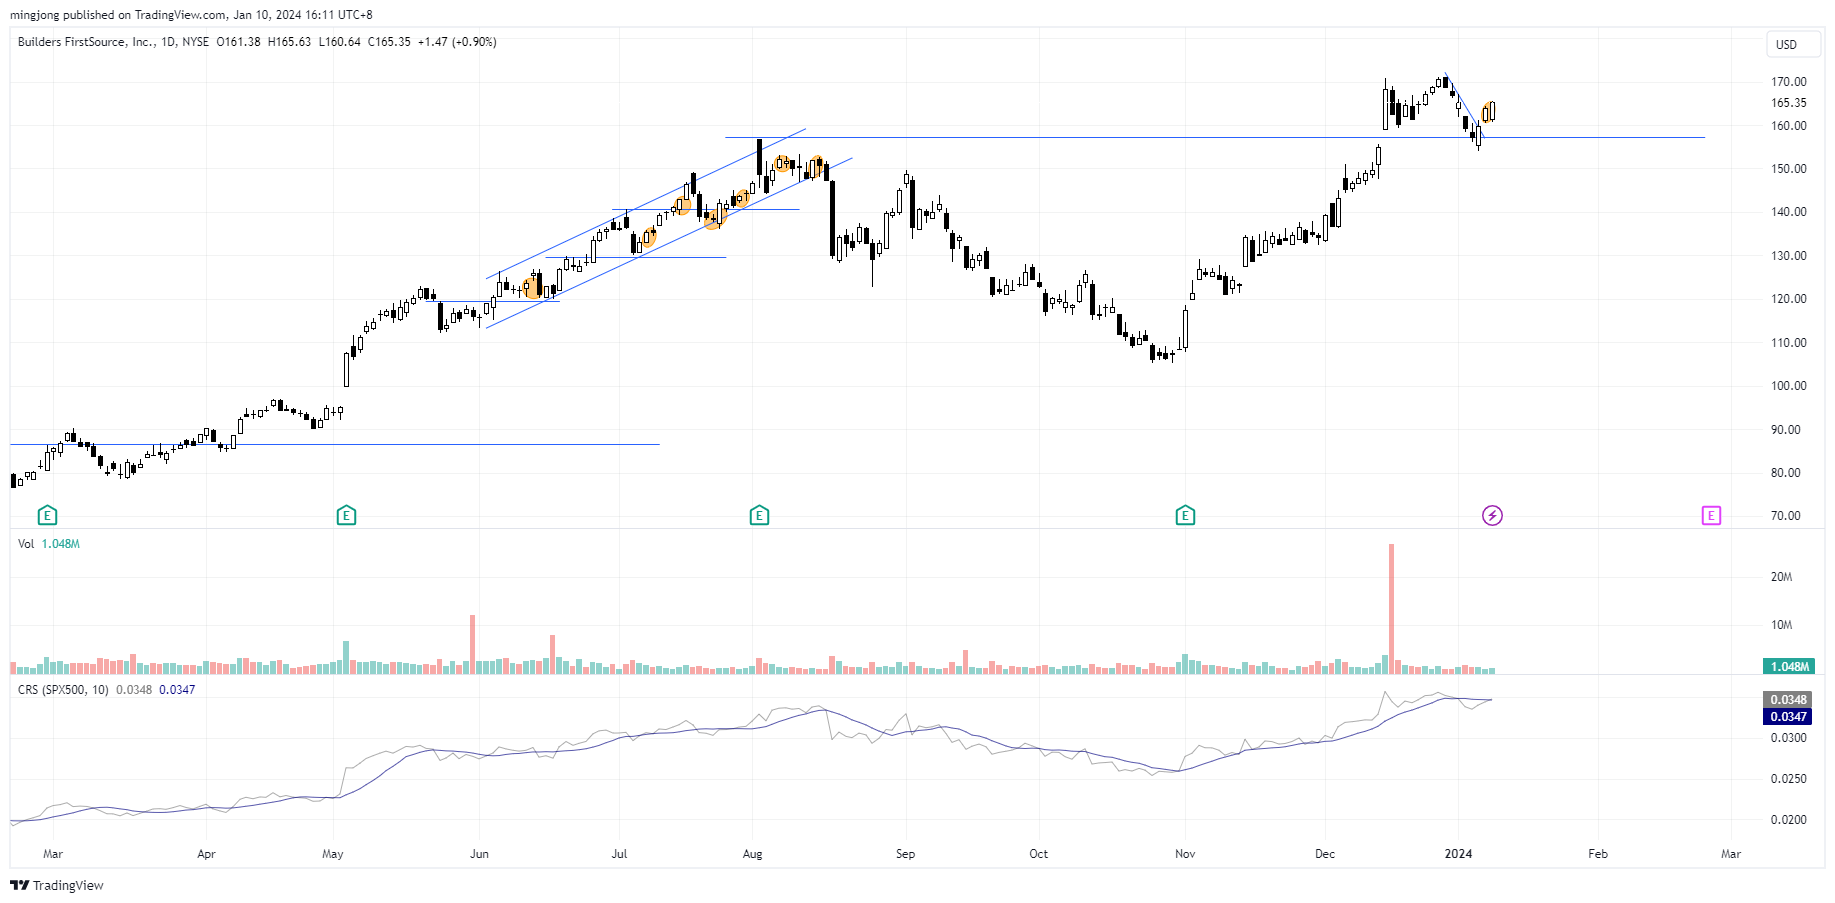
BLDR
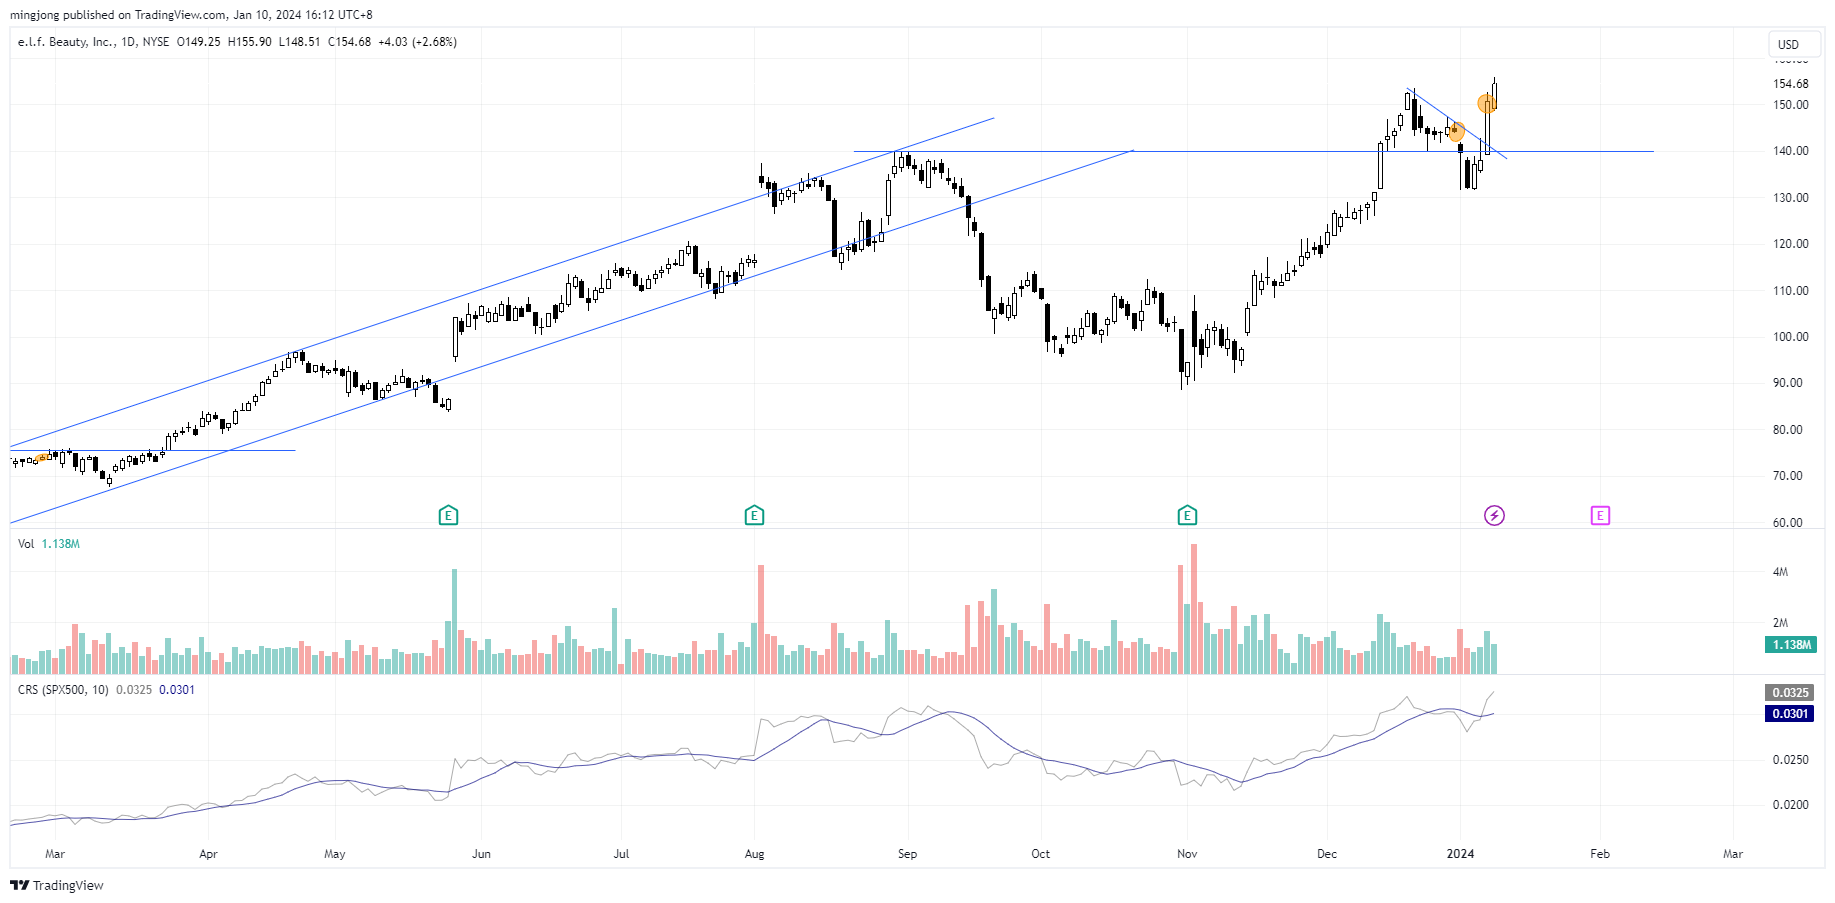
ELF
Author

Ming Jong Tey
Independent Analyst
Ming Jong Tey has been trading since 2008. He started his learning journey from technical analysis (indicators, Fibonacci, etc...) to value investing. Throughout his journey, he develops an interest in price action with chart pattern trading.


