$SPX: The Expanded flat, which tricked buyers last month [Video]
![$SPX: The Expanded flat, which tricked buyers last month [Video]](https://editorial.fxstreet.com/images/Markets/Equities/SP500/wall_street_nyse1-637299020939878938_XtraLarge.jpg)
The Expanded Flat is one of trickiest structures in the Elliott Wave Theory. The structure comes with a strong reaction after new highs are made. But the idea is that the reaction comes in five waves, which confuse wavers. As a result, wavers often get trapped by the structure. When Mr. Elliott developed the theory back in the 1930s, he did not have the tools which we have today. We at EWF have developed a series of new rules. Some of those rules are explained in the article here. As we explained, the new set of rules allow us to identify the trap, so we can warn members and followers when it happens.
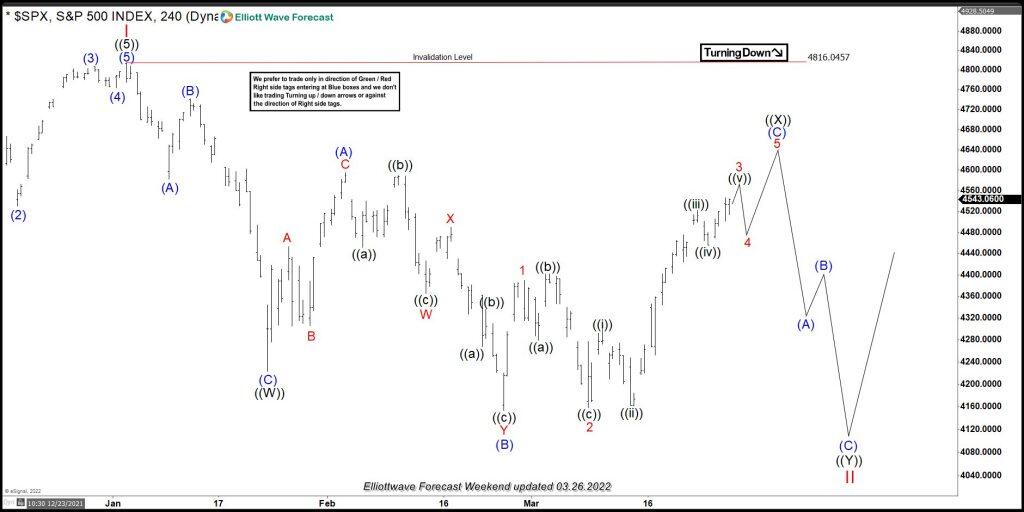
Correction in the market happens in the sequence of three, seven or eleven swings. The Expanded Flat always shows a divergence in the fifth swing but it is also showing five channels lower. It does not form a corresponding sequence in the momentum indicators however, which makes the sequence corrective. Here is what the Expanded Flat looks like in the Elliott Wave Theory:
As we can see the B wave trades above the beginning of the A wave. However, the market reacted lower, and pass the low of wave A. The reaction lower comes in five waves making all the wavers chase the wrong upside breakout. As we mentioned above, it is very tricky, and only having a new set of rules, and understanding of the market nature sequences will make traders avoid the traps.
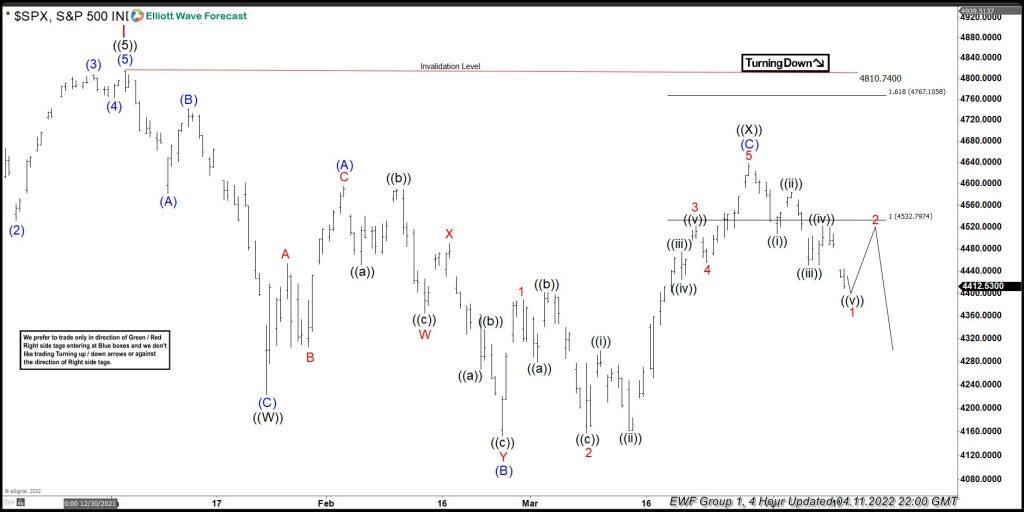
Back in early March 2022, the $SPX makes new lows below the 01.24.2022. However, it never reached the 100% from the 01.04.2022 peak. The low comes with momentum divergence against the 01.24.2022. Back in the 1930s it was easy to get trapped by the market, but in 2022 it was easy for us to be able to see the trap. Here is the 4 Hour chart provided to members during 03.26.2022 update showing the proposed Flat taking place and the turn lower.
$SPX – 4 hour update from 3.26.2022 :
The Index ended the 5 waves structure and then we called lower early in the turn. Our members already knew at the moment that the sequences was incomplete. Consequently, a sell-off was coming into the ((Y)). Market turned lower as expected above. Now it is ending the seven swing structure by erasing the momentum divergence.
$SPX – 4 hour update from 4.11.2022 :
Check out the following video, which explains whole idea and how the sequence identified.
Author

Elliott Wave Forecast Team
ElliottWave-Forecast.com


