|

SPX: Strong momentum, but are risks building?

Section 1: Strong momentum of daily chart

Chart

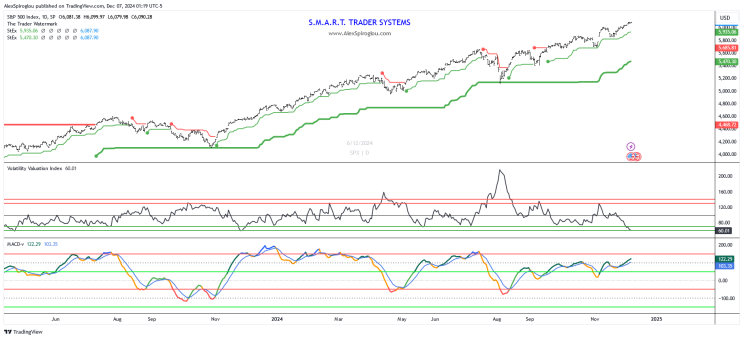
The SPX daily chart presents an interesting contrast between momentum and volatility —two indicators that often don’t move in sync.

Let’s break it down using our "Chart Checklist":

  • Trend: Stage 1 (Short-term and long-term trends are both up).

  • Momentum: Range 3 (Rallying, with MACD-v > 100 and hitting new highs).

  • Volatility: Range 1 (Complacency).

While momentum is undeniably strong, (MACD-v > 100 AND making new momentum highs) volatility is signaling something different.

As highlighted yesterday, the Volatility Valuation Index (VVI) suggests subtle complacency creeping into the market.

This divergence raises a question: can the market sustain such strong momentum, or is it setting up for a reversal / retracement ?

Perhaps the answer lies outside of the daily chart...

Section 2: Too strong momentum of monthly chart

Chart

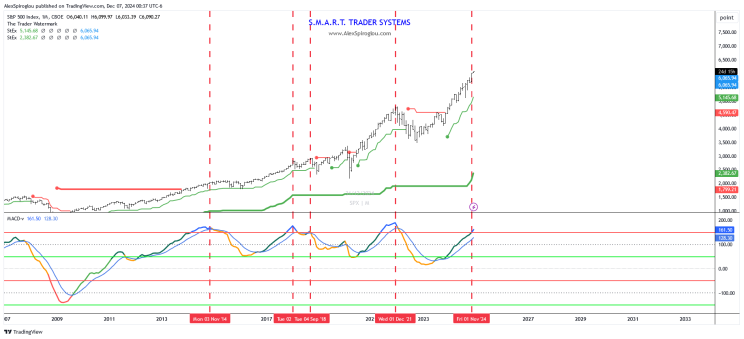
Zooming out to the monthly chart,

The MACD-v (12,26) shows momentum in the "Risk Range" (>150).

Historically, this level correlates with corrections, ranging from minor pullbacks to full-blown bear markets.

This signal doesn’t appear often, but when it does, it’s worth paying attention to.

Still, no indicator should be used in isolation— it’s all about combining factors like trend, momentum, and volatility, breadth, sentiment, etc for a clearer picture.

Author

Alex Spiroglou, CFTe, DipTA (ATAA)

Alex Spiroglou is a quasi-systematic, cross-asset proprietary futures trader. His involvement with capital markets began in 1998, having worked for various proprietary trading and investment management firms in the UK and Greece.

More from Alex Spiroglou, CFTe, DipTA (ATAA)
Share:

Editor's Picks

EUR/USD holds steady above 1.1850 in quiet session

EUR/USD stays defensive but holds 1.1850 amid quiet markets in the European hours on Monday.  The US Dollar is struggling for direction due to thin liquidity conditions as US markets are closed in observance of Presidents' Day holiday. 

GBP/USD flat lines near 1.3650 ahead of UK and US data

GBP/USD kicks off a new week on a subdued note and oscillates in a narrow range near 1.3650 on Monday. The mixed fundamental backdrop warrants some caution for aggressive traders as the market focus now shifts to this week's important data releases from the UK and the US.

Gold sticks to intraday losses; lacks follow-through

Gold remains depressed through the early European session on Monday, though it has managed to rebound from the daily trough and currently trades around the $5,000 psychological mark. Moreover, a combination of supporting factors warrants some caution for aggressive bearish traders, and before positioning for deeper losses.

Bitcoin consolidates as on-chain data show mixed signals

Bitcoin price has consolidated between $65,700 and $72,000 over the past nine days, with no clear directional bias. US-listed spot ETFs recorded a $359.91 million weekly outflow, marking the fourth consecutive week of withdrawals.

The week ahead: Key inflation readings and why the AI trade could be overdone

It is likely to be a quiet start to the week, with US markets closed on Monday for Presidents Day. European markets are higher across the board and gold is clinging to the $5,000 level after the tamer than expected CPI report in the US reduced haven flows to precious metals.

Monero Price Forecast: XMR risks a drop below $300 under mounting bearish pressure

Monero (XMR) starts the week under pressure, recording a 4% decline at press time on Monday after a 7% drop the previous day, putting the $300 support zone in focus.