|

SPX: Market has a bad brea(d)th

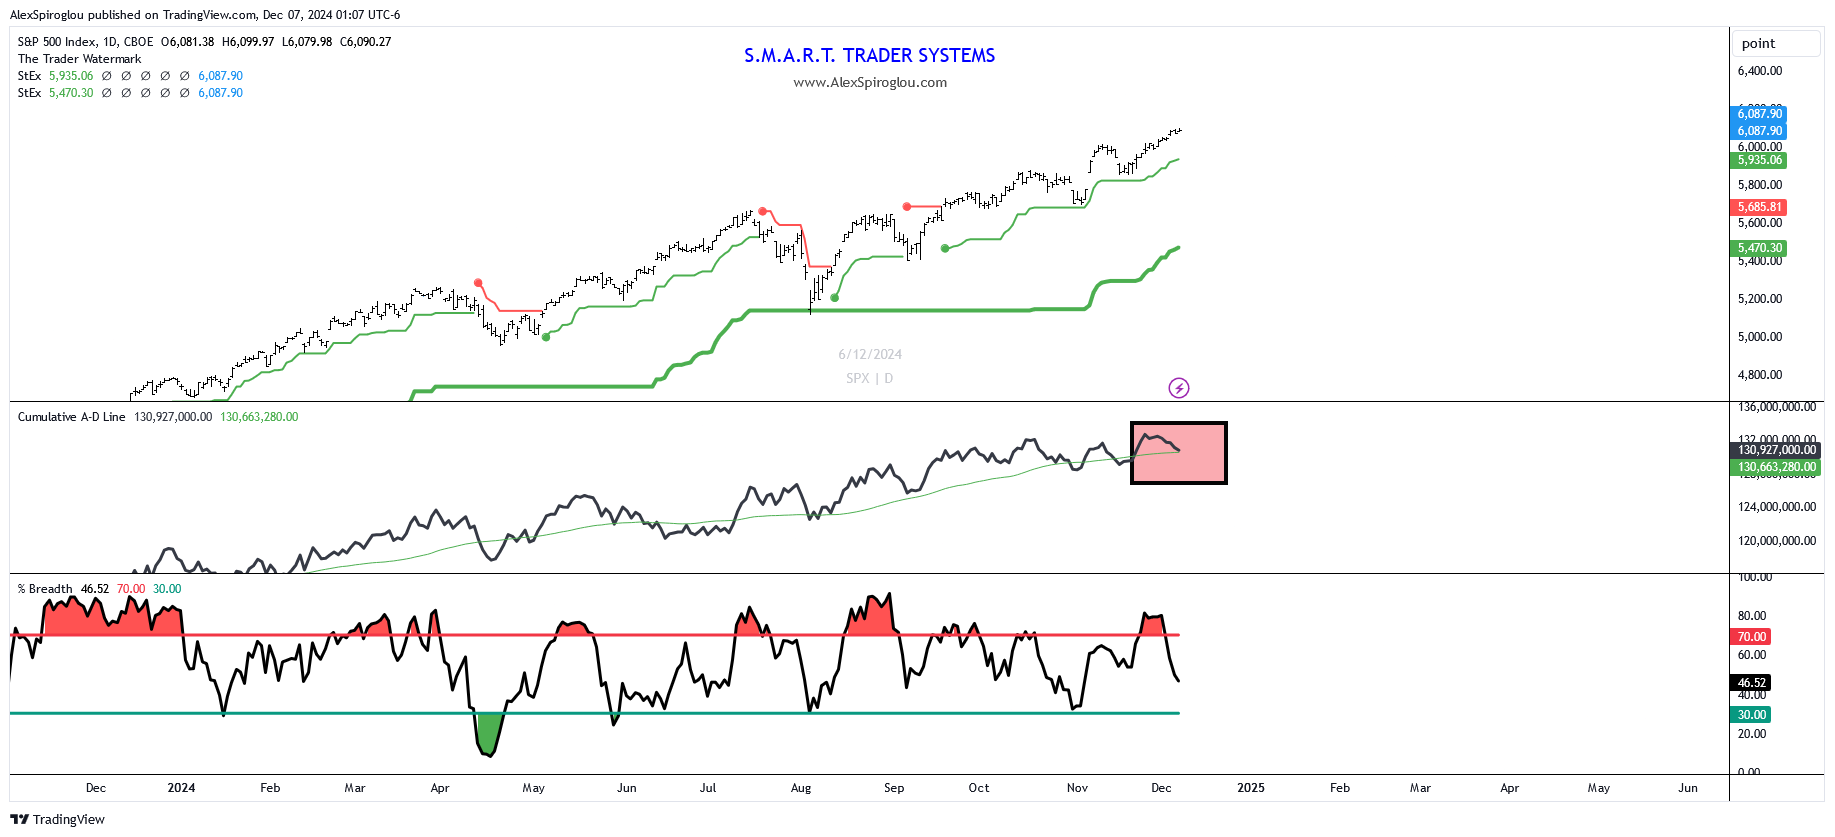
TOP PANEL: SPX & Volatility Stops

BOTTOM PANEL: % of SPX stocks > 20 MA , NYSE A/D line

Section 1: The market has bad brea(d)th

When it comes to the market’s foundation, things aren’t looking as strong as they seem.

The middle panel of the chart highlights the cumulative NYSE A/D line,

which tracks the net number of advancing vs. declining stocks on the NYSE.

Right now, it’s flashing a warning: despite the index hitting new highs,

the A/D line isn’t confirming this move (highlighted in red).

In the third panel, the percentage of SPX stocks trading above their 20-day EMA

(short term breadth) is also slightly concerning.

It recently hit overbought levels (>70) but is now declining,

another warning for the market’s strength.

Section 2: About the Indicators

  • NYSE A/D Line: This measures market breadth by comparing advancing stocks to declining stocks. A rising line confirms broad participation, while a divergence signals fewer stocks driving the rally.
  • % of SPX Stocks > 20 EMA: This indicator shows the percentage of SPX stocks trading above their 20-day exponential moving average. Readings above 70% suggest overbought conditions, while a decline signals weakening momentum.

Author

Alex Spiroglou, CFTe, DipTA (ATAA)

Alex Spiroglou is a quasi-systematic, cross-asset proprietary futures trader. His involvement with capital markets began in 1998, having worked for various proprietary trading and investment management firms in the UK and Greece.

More from Alex Spiroglou, CFTe, DipTA (ATAA)
Share:

Editor's Picks

AUD/USD picks up amid easing geopolitical tensions, bright data from China

The Australian Dollar posts moderate gains against the US Dollar on Tuesday, regaining some of the ground lost last week, although it remains at its lowest level in nearly two months. News that Israel and Iran halted hostilities has triggered a mild relief rally. At the same time, upbeat Chinese trade data has provided additional support for the Aussie, as China is Australia’s major trading partner.

Japanese Yen steadies near recent lows as ceasefire, Japan intervention threats offset

USD/JPY trades around 160.15 on Tuesday, remaining close to its highest level since April 30 despite a broadly neutral intraday performance. The pair retains an underlying bullish bias, supported by expectations that US monetary policy will remain restrictive, although upside potential is being capped by the risk of intervention from Japanese authorities.

Gold stays slightly bid near $4,340

Gold remains stuck in a narrow range on Tuesday, still trading below the $4,400 mark per troy ounce. The precious metal’s marginal advance comes on the back of easing geopolitical tensions and a deeper retracement in the US Dollar, although the likelihood of a cautious Fed down the road should keep the metal under scrutiny.

Crypto Today: Bitcoin, Ethereum, XRP edge lower despite Middle East tensions easing

Cryptocurrency prices trade amid persistent selling pressure on Tuesday. Bitcoin (BTC) hovers near $63,000, Ethereum (ETH) above $1,650, and Ripple (XRP) around $1.14.

Hotter US inflation numbers could further bolster Fed hike bets

Middle East tensions keep inflation risks elevated. Fed hike fully priced in by year end amid strong NFP report. US CPI data on Wednesday (12:30 GMT) to enter the spotlight. Further acceleration in inflation could drive the Dollar higher.

The US economy defies the rules: 100 days into the Oil shock and the recession signal is still missing

More than three months after the start of the Iran war and the resulting disruption to global energy markets, the US economy continues to display remarkable resilience. The conflict has triggered a sharp rise in Oil prices, reignited inflationary pressures and fueled widespread concerns about a potential economic slowdown.