Spotify (SPOT) Elliott Wave technical analysis

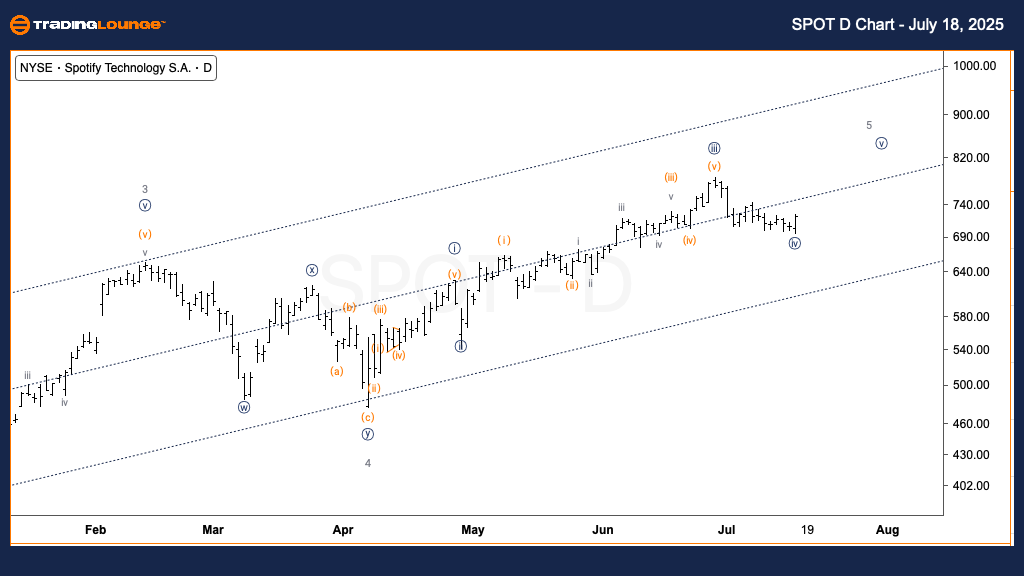
SPOT Elliott Wave technical analysis – Daily chart
-
Function: Counter-Trend.
-
Mode: Corrective.
-
Structure: Flat.
-
Position: Wave {iv} of 5.
-
Direction: Potential bottom forming in Wave {iv}.
Analysis
Spotify (SPOT) appears to be in the later stages of a corrective flat pattern on the daily chart, forming Wave {iv} of the broader Wave 5 sequence. Price action has remained around the mid-line of a temporary parallel trend channel, suggesting limited downside pressure and a potential shift toward the next upward move. The corrective phase seems near completion, positioning SPOT for a possible bullish continuation into Wave 5.
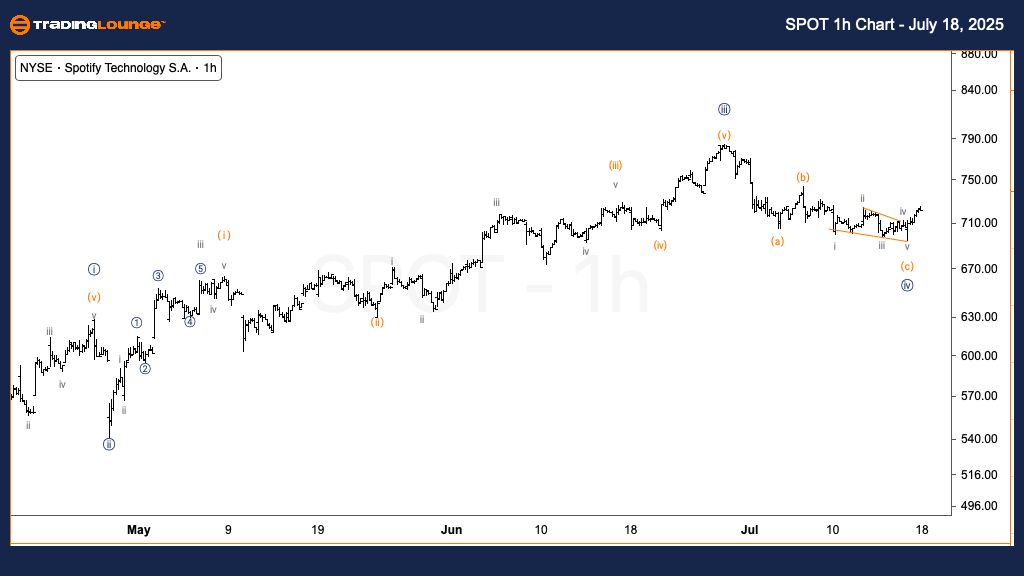
SPOT Elliott Wave technical analysis – One hour chart
-
Function: Counter-Trend.
-
Mode: Corrective.
-
Structure: Flat.
-
Position: Wave (c) of {iv}.
-
Direction: Possible bottom formation in Wave {iv}.
Analysis
The 1-hour chart highlights a possible ending diagonal developing within Wave (c) of {iv}, often indicating a correction is near exhaustion. If validated, this structure would signal the end of the corrective phase and a resumption of upward momentum toward the $800 target zone in Wave {v}. Traders should look for a breakout from the diagonal structure to confirm the bullish scenario.
Author

Peter Mathers
TradingLounge
Peter Mathers started actively trading in 1982. He began his career at Hoei and Shoin, a Japanese futures trading company.


