SPDR S&P 500 ETF Trust (SPY) News and Forecast: Why is SPY going up? Is it a sell?
- SPDR S&P 500 (SPY) continues bouncing on Thursday.
- SPY ETF retraces to the 21-day moving average.
- Is this a dead cat bounce or time to buy the dip?

The SPY continued its recovery play on Thursday as the move accelerated from Wednesday's positivity. Wednesday was the first up day for the SPY in five sessions with a 0.98% gain, but the move picked up the pace on Thursday when SPY closed up 1.22%. Not exactly stellar but solid steady performance after a tough September. The catalyst was the by now well-discussed Evergrande situation. With an interest payment being made by the sick man of the Chinese real estate industry, markets were less nervous over this. More pertinent though was the Fed surprising markets slightly with the lack of a tapering timeline but discussing a rate hike in 2022.
We feel the reaction was overall positive as rate hikes are now in investors' minds and not causing too much distress. Technically, the short term may provide some difficulties, and the market mood appears to be looking for negative news flow: never a good sign. Evergrande is unlikely to be another Lehman, but nervousness is rising. Keep an eye on the VIX for your guide to this. Despite yesterday's rally, the VIX spiked back to near 20 again. When the VIX spikes above 20 this year, it has been signaling some trouble ahead for stocks.
-637680748309757606.png)
SPY 15-minute chart
As we can see the move on Thursday was straight from the open and this strength carried through for the remainder of the session. The SPY also closed near the high of the day.
SPY stock forecast
The weekly chart below shows the long-term wedge formation in place since nearly this time last year. The SPY has just broken out of this wedge and put in place a series of lower continuation bars. Clearly, the uptrend is stalling or at least presenting us with a dip opportunity. Taking out last week's high at $448.92 is unlikely this week, so next week's target will be this week's high at $444.89 to give a potential reversal candle on the weekly chart.
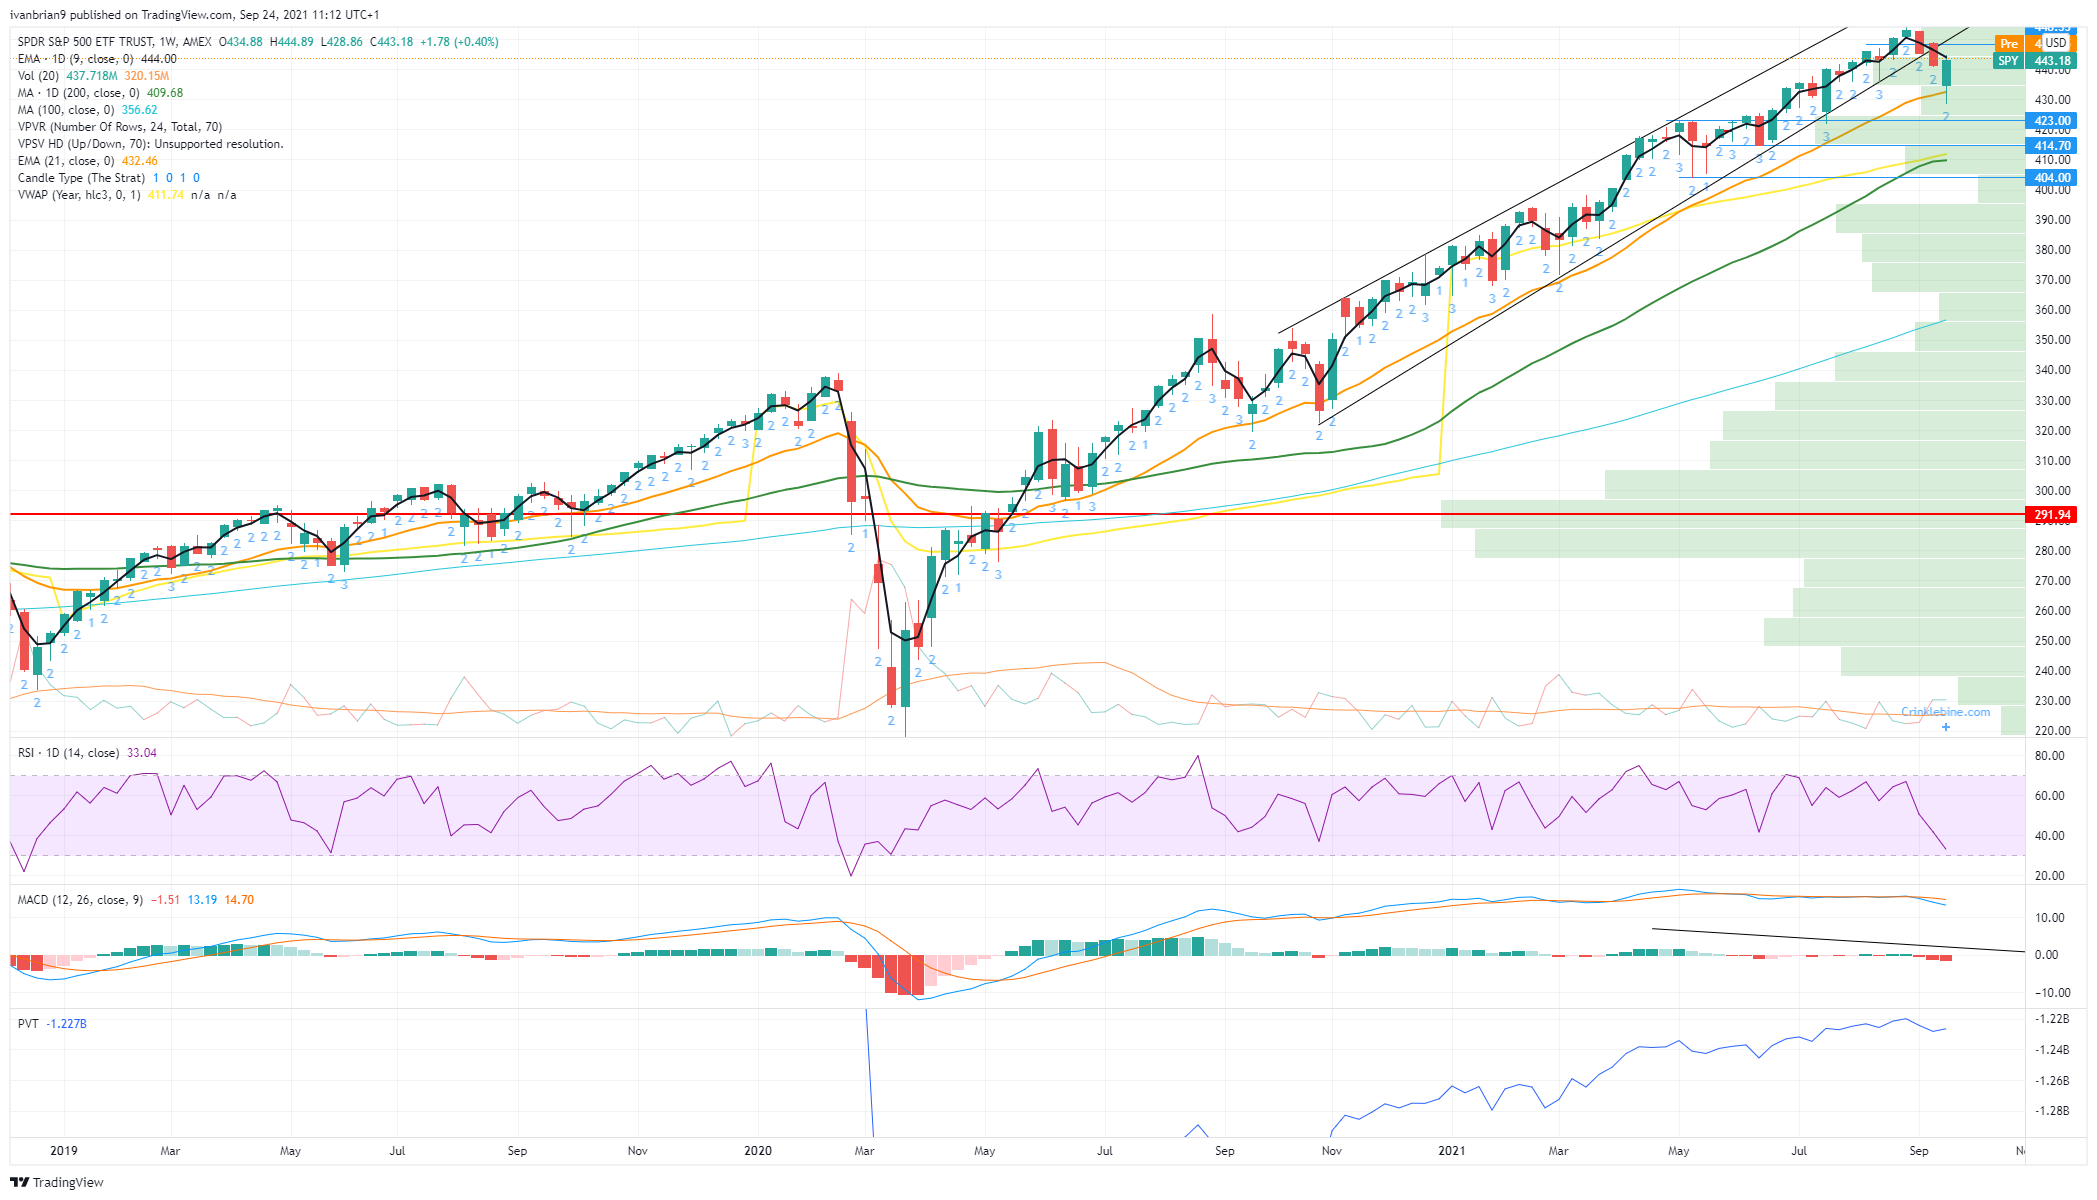
SPY weekly chart
Looking at the daily chart, this one starts to look more and more like a reversal when you see we created a lower low by breaking the 19 August low. We already have a series of lower highs in place. This is the first time in 2021 we have dipped below a previous dip level. Below $432 the volume profile bars also drop off, meaning a move could accelerate to the next high volume support zone at $420. The recovery on Wednesday and Thursday was also not enough to take the Relative Strength Index (RSI) above 50 and so is technically in bearish territory.
FXStreet View: Bearish, bullish above $448.92.
FXStreet Ideas: Sell near $448 with a stop above a break of $448.92. Stong support zone is at $414.
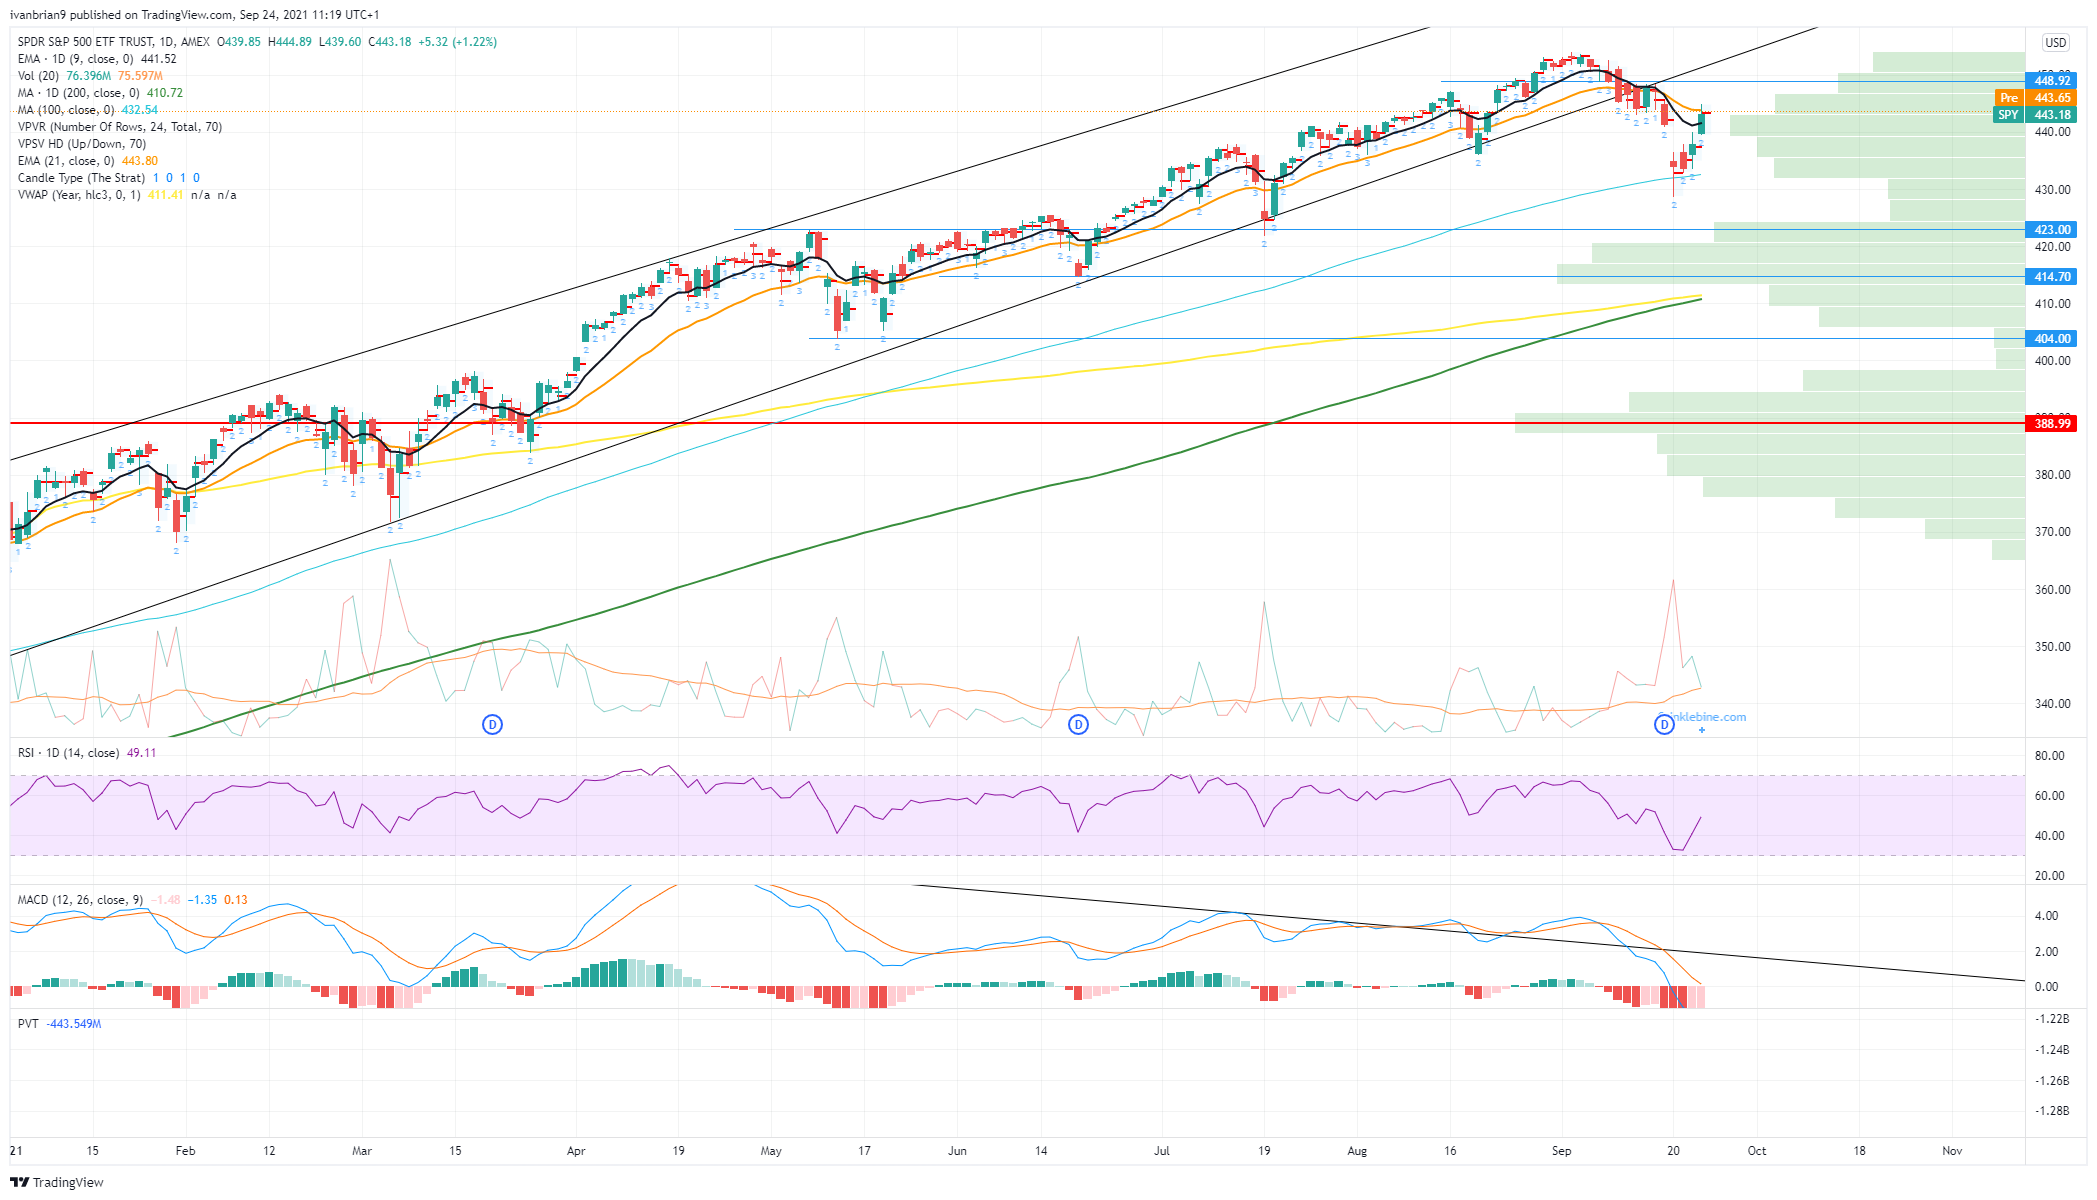
SPY daily chart
Premium
You have reached your limit of 3 free articles for this month.
Start your subscription and get access to all our original articles.
Author

Ivan Brian
FXStreet
Ivan Brian started his career with AIB Bank in corporate finance and then worked for seven years at Baxter. He started as a macro analyst before becoming Head of Research and then CFO.


