SPDR S&P 500 ETF Trust (SPY) News and Forecast: Why is the SPY down today?
- S&P 500 stages the perfect dead cat bounce to the 9-day moving average.
- More selling pressure hits equities as yields rise again.
- SPY lags Nasdaq as tech stocks struggle off the canvas.
Update: Those jumpy yields have risen again and once again stocks are taking it badly. The Nasdaq is especially sensitive to yields but the sentiment acorss the board is negative with no sectors in the green bar crypto stocks. Defensive names are the best performing outside of crypto with XLP down just 0.25% while XLE Energy is the worst performing secotr as profit taking hits after the oil price surge.
Finally, the stock market puts in a nice green candle after a few shaky sessions, but this was not exactly a bullish revival, more like the dead cat bounce off the canvas we had been predicting. The stock market and the SPY are still standing, but the count is on. Time will tell, but to us the sentiment still looks bearish. This dip has not been bought, and the longer this goes on the greater panic will ensue. The VIX yesterday spiked higher again despite the rally. VIX is now at 23.72, and markets this year have not liked the VIX above 20. Once again yields are back in play with a decent move yesterday to 1.55%. Repeat, the Nasdaq does not like higher yields. We expect further falls on Wednesday as US traders wake up to higher yields and higher volatility. The dollar certainly is proving to be the lead indicator in this regard. It has once again strengthened and is up nearly 0.5% this morning. While 0.5% may not seem like much to stock traders, currency traders will know that it is a significant move. The dollar is liking these hawkish tones and higher yields. The stock market will not.
-637691140256341592.png)
SPY 15-minute chart
SPY stock forecast
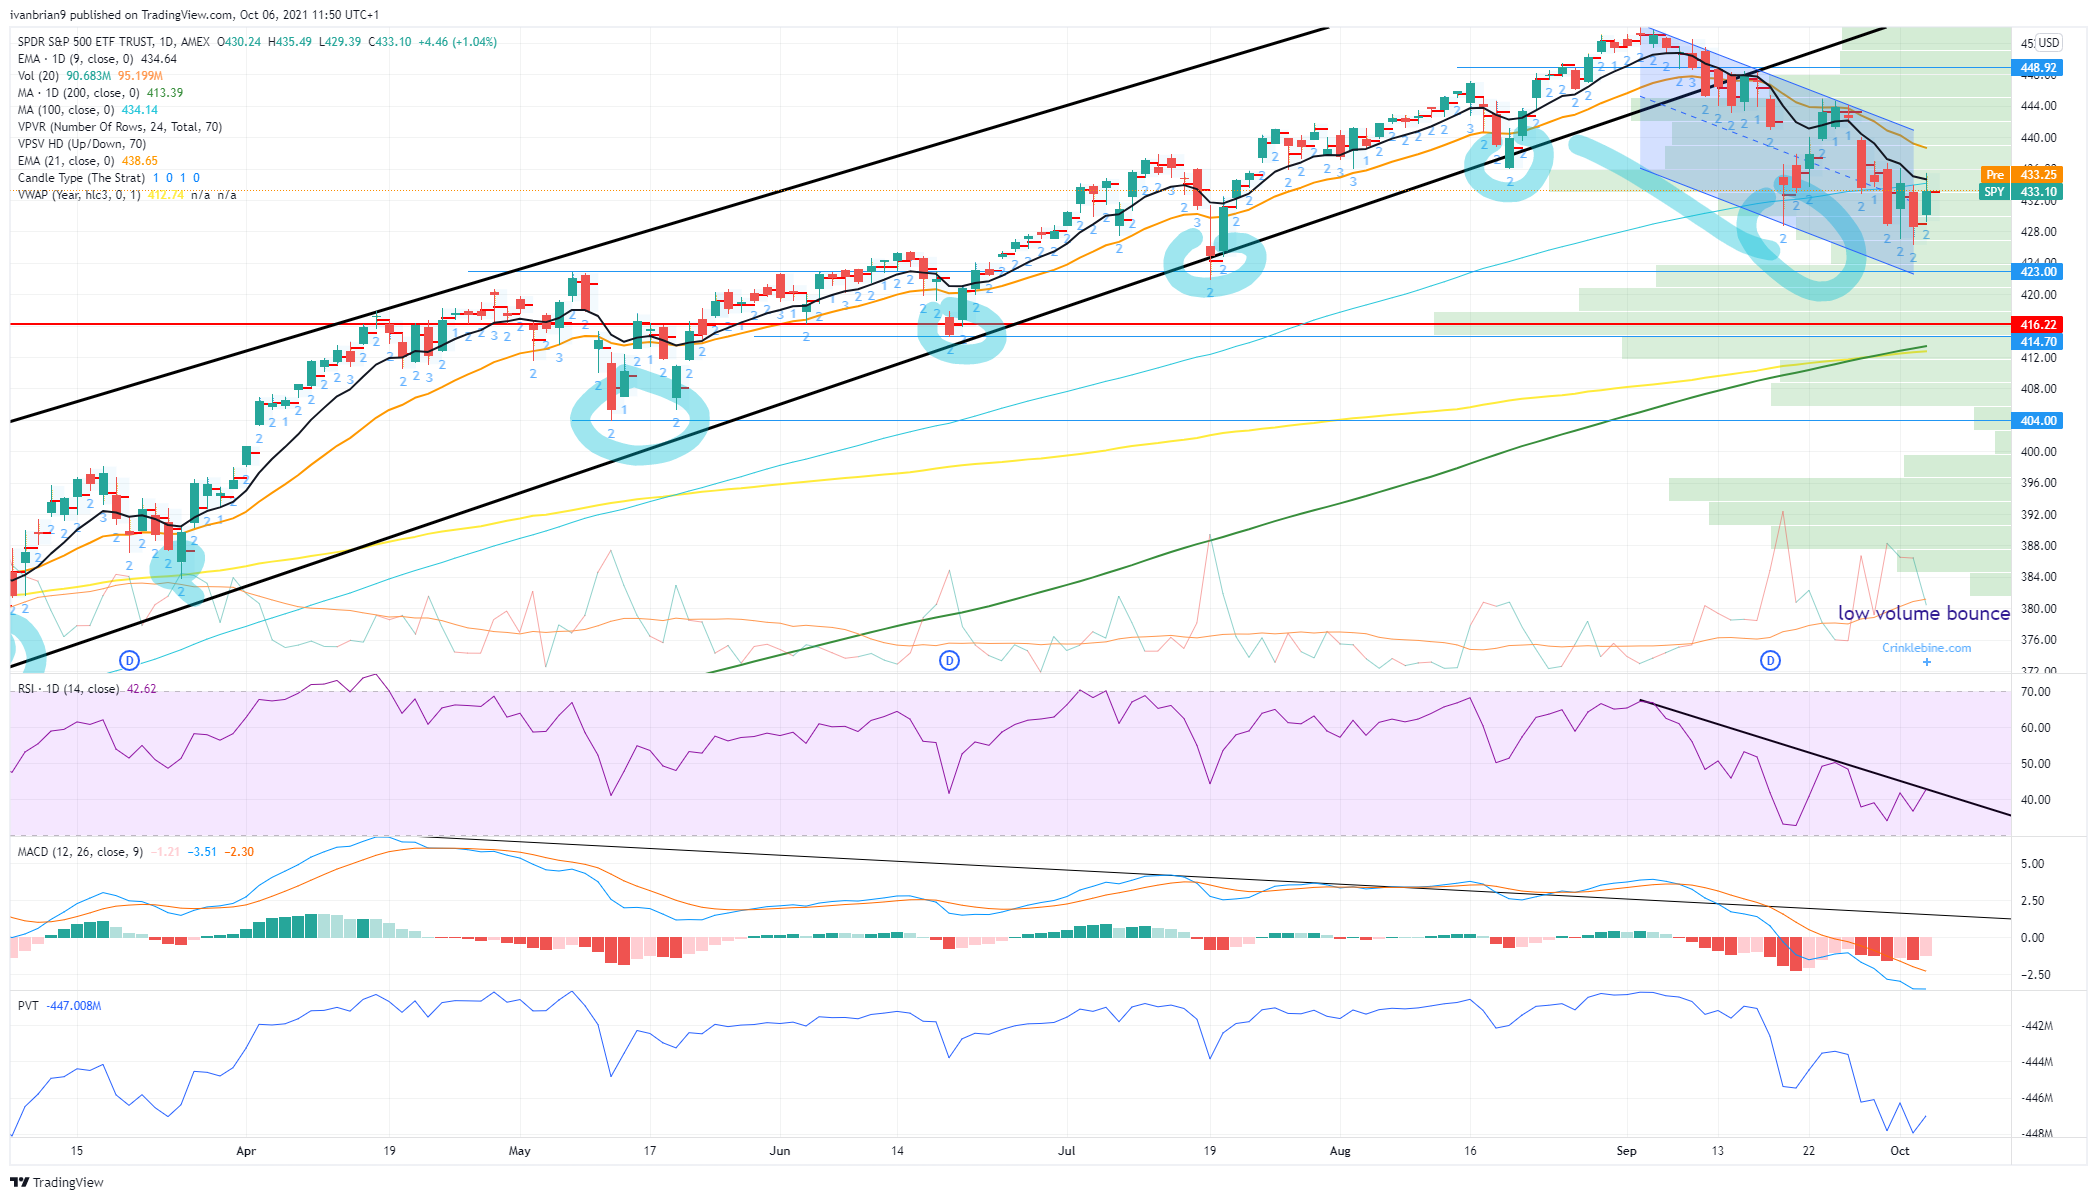
Nothing has changed our bearish call, and we stick with it. Tuesday was a dead cat bounce. Volume was low across the board, and we can see that clearly in the SPY chart below. The volume has occurred during falls, a bearish sign. The Relative Strength Index (RSI) continues to trend lower with the price, and the Moving Average Convergence Divergence is also heading south and confirming the price fall. We have repeatedly stuck with $436 as the important pivot point. Again we had a failure yesterday with the high at $435.49.
Our buy-the-dip zone remains at $415. We like this level due to the strong volume when the SPY last traded down here, shown by the volume profile bars on the right of our daily chart below. Also down here are the 200-day moving average and the yearly volume Weighted Average Price (VWAP).
FXStreet View: Bearish, neutral above $436.
FXSTreet Ideas: Buy the dip at $415 as mentioned, stong support from the 200-day moving average and a lot of volume at this level.
Premium
You have reached your limit of 3 free articles for this month.
Start your subscription and get access to all our original articles.
Author

Ivan Brian
FXStreet
Ivan Brian started his career with AIB Bank in corporate finance and then worked for seven years at Baxter. He started as a macro analyst before becoming Head of Research and then CFO.


