S&P500 update: The anatomy of an impulse rally
Using the Elliott Wave (EW), we have successfully tracked the most likely path forward for the SP500 (SPX) over several months. Already in November last year, we found
“Ending Diagonals (EDs) are tricky because all their waves comprise three waves: 3-3-3-3-3. Besides, W-iii typically targets the 123.60% extension of W-i, measured from W-ii. The W-iv then tends to correct back to the 61.80% extension, after which the last W-v targets the 161.80% extension. In this case, we are looking at W-iii to reach at least SPX6060, W-iv should bottom around SPX5725, and W-v can reach at least SPX6260.”
(Grey) W-iii topped December 6 at $6099, and (grey) W-iv may have bottomed out on January 13 at SPX5773, while (grey) W-v only reached $6147 on February 19. See Figure 1 below. The former two waves reached their ideal Fibonacci-based target zones (grey squares) for an ED, whereas the latter fell short of its target (grey arrows). Although price is the final arbiter, and the markets do not owe us anything, i.e., they do not have to reach ideal target zones, such a big miss is uncommon and troubling for this potential wave count. More about that later.
Figure 1. Elliott Wave count for the SP500 since August 2024
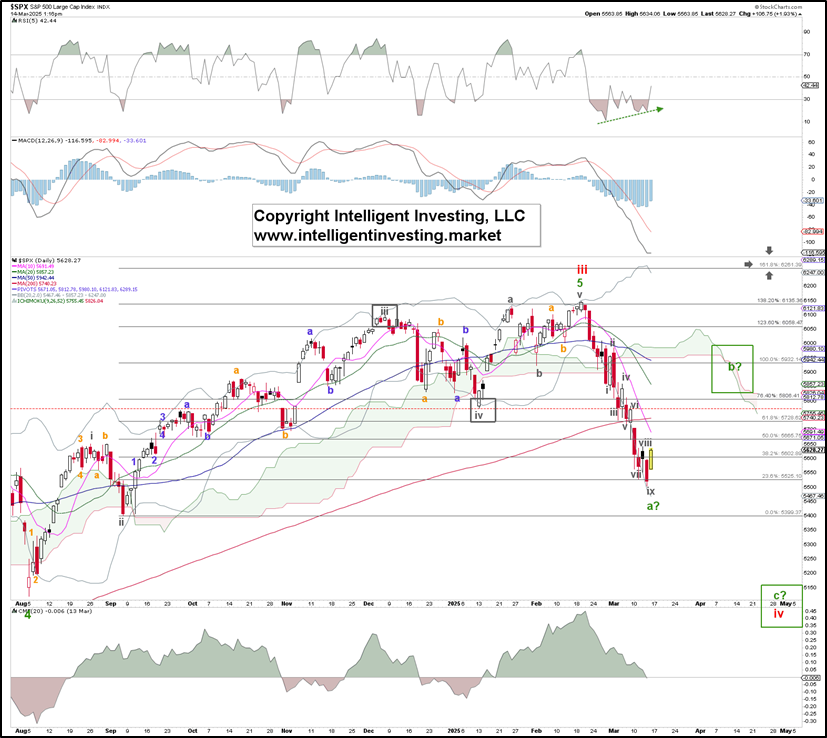
Namely, in our previous update, we showed the index had one last chance to reach that 161.80% Fibonacci extension at $6260, contingent on holding above that day’s low ($5732) and especially the $5650 level. If it did not, it could drop to as low as $5250. Fast-forward, and so far, the SPX bottomed at $5504 yesterday.
If we zoom out, we find the index peaked at the 100% Fib-extension of the 2020-21 rally, $6121 vs. $6147 measured from the 2022 low. See Figure 2 below.
Figure 2. Elliott Wave count for the SP500 since March 2020, aka the COVID low
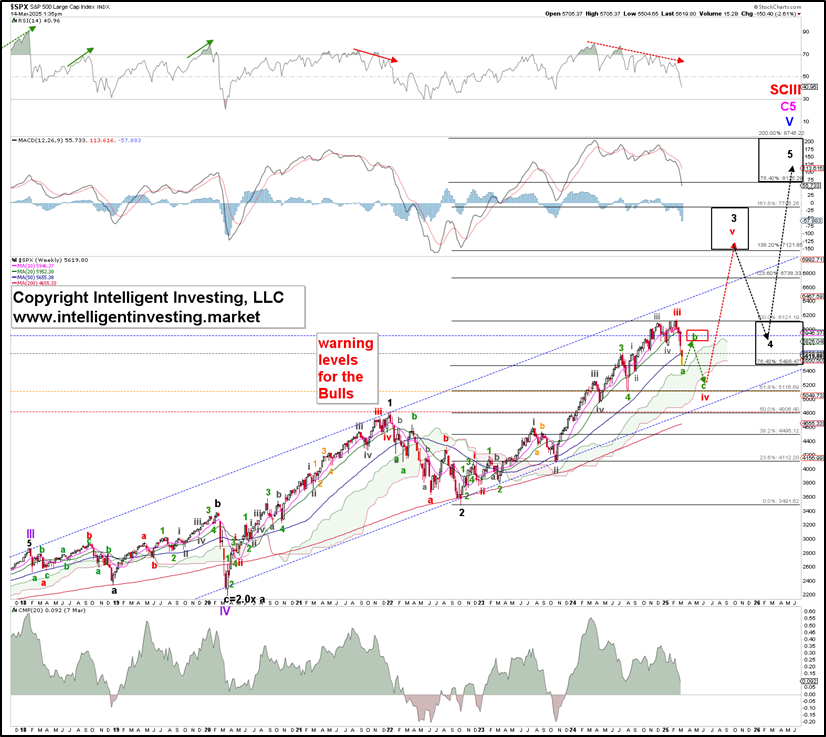
In a standard Fibonacci-based impulse pattern, the third-of-a-third wave, in this case (red) W-iii of (black) W-3, tends to target the 100-123.6% extension of W-1, measured from W-2. The fourth wave often returns to the 61.8-76.4% Fib-extension, followed by a fifth wave targeting the 138.2-161.8% extension to complete the more significant third wave. In this case, the target zones are $6121-$6738, $5498-$5117, and $7122-7746, respectively. So far, the SP500 has reached $6147 and $5504, close to the 100% and 76.4% extensions, off by only a few tenths of a percent point.
Although in this case, the (red) W-iv of the black W-3 should ideally target the 61.80% Fib-extension because the W-iii reached the 100% extension, it is not necessary, since 4th waves often retrace 23.6-38.2% of the prior 3rd wave, which means the 76.4% extension at $5498 suffices. Besides, we can now re-address the “big miss” of the index by not hitting $6260 and instead peaking at $6147. It would make more sense that it was an irregular b-wave top of an expanded flat wave-iv correction. See Figure 3 below. In such a correction the W-b is larger than the W-a, and the c-wave is even longer.
Figure 3. Elliott Wave count for the SP500 since March 2020, aka the COVID low
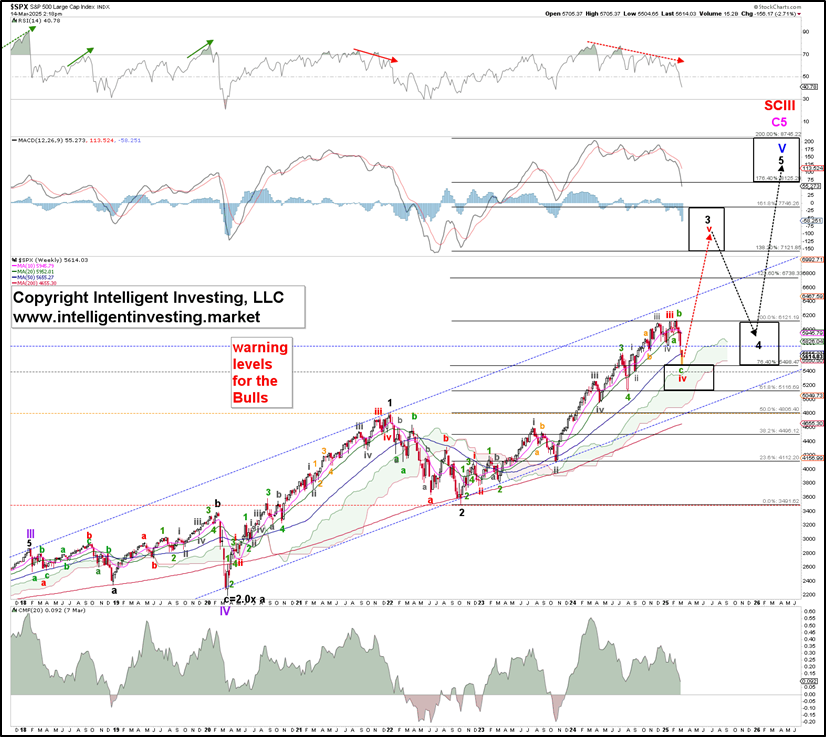
In this case, the red W-iii peaked at $6128 on January 24, even closer to the ideal target of $6121 than the $6147 top (7p vs 26p). Thus, based on well-known time-proven patterns we find that the index recently topped right at the lower end of a typical 3rd of a 3rd wave target zone. Yesterday, it also bottomed right at the upper end of a typical 4th of a 3rd wave target zone. Both were within 0.1% of the ideal Fibonacci-based levels.
Contingent on holding above yesterday’s low, the index can rally to ideally $7122-7746 to complete the more extensive third wave, black W-3, per Figure 3. If the index stalls out at around $5900+/-100 and then drops below this week’s low, the path shown in Figure 1 and 2 is operable. In that case, we expect the SPX to target the 61.8% extension at $5116 before the red W-v to $7122-7746 kicks in.
Given how sour the mood is on Wall Street currently, with AAII Bearish sentiment exceeding 57% for three consecutive weeks for the first time in the survey's history and the CNN Fear & Greed Index consistently at Extreme Fear since February 25, while Seasonality is turning up, a rip-roaring rally and even “just a 300-500p bounce” seems at this stage the most likely scenario.
Author

Dr. Arnout Ter Schure
Intelligent Investing, LLC
After having worked for over ten years within the field of energy and the environment, Dr.