|

SP500 (SPX) Elliott Wave: Calling the rally from the equal legs area

In this technical article we’re going to take a quick look at the Elliott Wave charts of SPX published in membership area of the website.  As our members know, S&P500 is trading within the cycle from the October 2022 low, which is unfolding as 5 waves structure.  We got 3 waves pull back which found buyers right at equal legs area as we expected.  In the further text we are going to explain the Elliott Wave Forecast

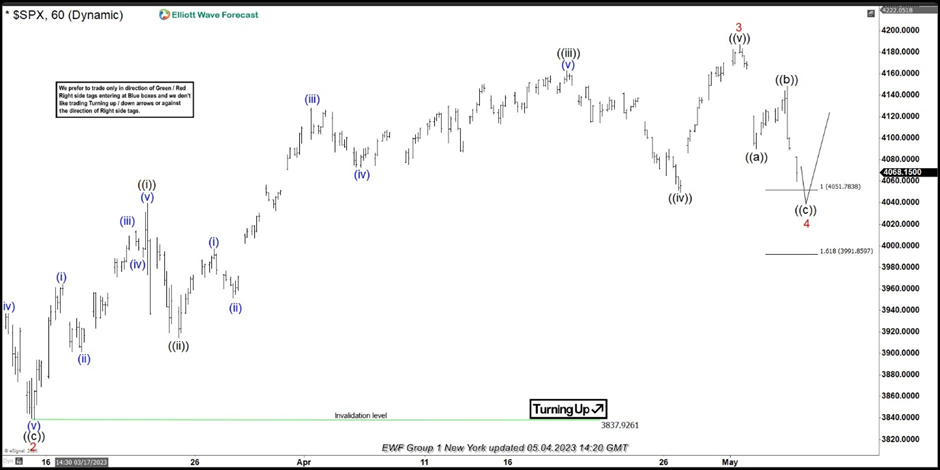
SPX 1h Elliott Wave analysis 05.04.2023

SPX is doing wave 4 red pull back. The index is correcting the cycle from the 3837.92 low. Pull back looks incomplete at the moment. It’s still short of equal legs area that comes at 4051.78- 3991.85. At that area SPX should ideally find buyers for further rally in wave 5 red or for a 3 waves bounce at least.

Chart

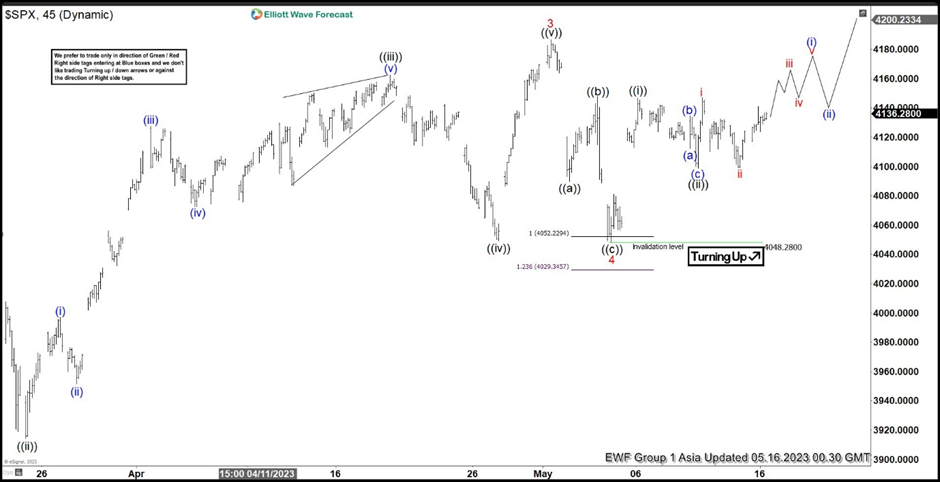
SPX 1h Elliott Wave analysis 05.16.2023

SPX made extension down toward equal legs area as we expected.  Buyers appeared at the marked extreme zone and we are getting good reaction from there. As far as 4048.28 low holds, SPX should ideally keep trading higher in wave 5 red targeting 4218.9-4271.7 area.

Chart

Author

Elliott Wave Forecast Team

Elliott Wave Forecast Team

ElliottWave-Forecast.com

More from Elliott Wave Forecast Team
Share:

Editor's Picks

EUR/USD strengthens as ECB hikes interest rates for first time since 2023

The EUR/USD pair gathers strength to around 1.1575 during the early Asian trading hours on Friday. The Euro edges higher against the US Dollar on the European Central Bank interest rate hike and improved risk sentiment.

GBP/USD recovers above 1.3400 on USD selloff

GBP/USD is back firm above 1.3400 with the Greenback giving up most of its weekly gains, following headlines coming from the United States signaling US President Donald Trump signed a proclamation in which he announced that a deal with Iran is pretty much sealed.

Gold consolidates above $4,200 as Hormuz risks and Fed bets support USD

Gold is seen consolidating the previous day's strong recovery from the YTD low and trading comfortably above $4,200 during the Asian session on Friday. Despite Trump's claim that a peace deal with Iran has been approved, a standoff over the Strait of Hormuz and Tehran's frozen funds keep a lid on the latest optimism. Furthermore, traders are still pricing in a greater chance of a rate hike by the Fed in 2026 amid sticky inflation, which helps revive the US Dollar demand and caps the upside for the bullion.

Crypto Today: Bitcoin, Ethereum, XRP rebound broadens despite continued US-Iran strikes

Bitcoin steadies its recovery on Thursday, edging higher toward $63,000 despite incessant capital outflows. Meanwhile, altcoins, including Ethereum and Ripple, exhibit subtle rebound signs, trading above $1,650 and $1.12, respectively.

AI Crypto Forecast: Bittensor, Near Protocol, Internet Computer rebound gains traction 
Cryptocurrency prices are broadly rising on Thursday, following an overstretched downtrend. Despite sticky geopolitical tensions in the Middle East, tokens at the intersection of the blockchain technology and Artificial Intelligence (AI), including Bittensor (TAO), Near Protocol (NEAR) and Internet Computer (ICP) are testing recovery potential.
4.2% headline, 0.2% core: Why the Fed's next hike may be targeting the wrong problem

May's CPI put headline inflation at 4.2% on the year, up from 3.8% in April and the hottest reading since April 2023, while core prices rose just 0.2% on the month, undershooting the 0.3% consensus and halving April's pace.