SP500 remains on track for 6400-6500

Using the Elliott Wave (EW), we have successfully tracked the most likely path forward for the SP500 (SPX) over several months. Although there are many ways to navigate the markets and to each their own, we find the EWP to be the most reliable and accurate. Namely, already in November last year, we found
“Wave-iii to reach at least SPX6060, Wave-iv should bottom around SPX5725, and Wave-v can reach at least SPX6260.”
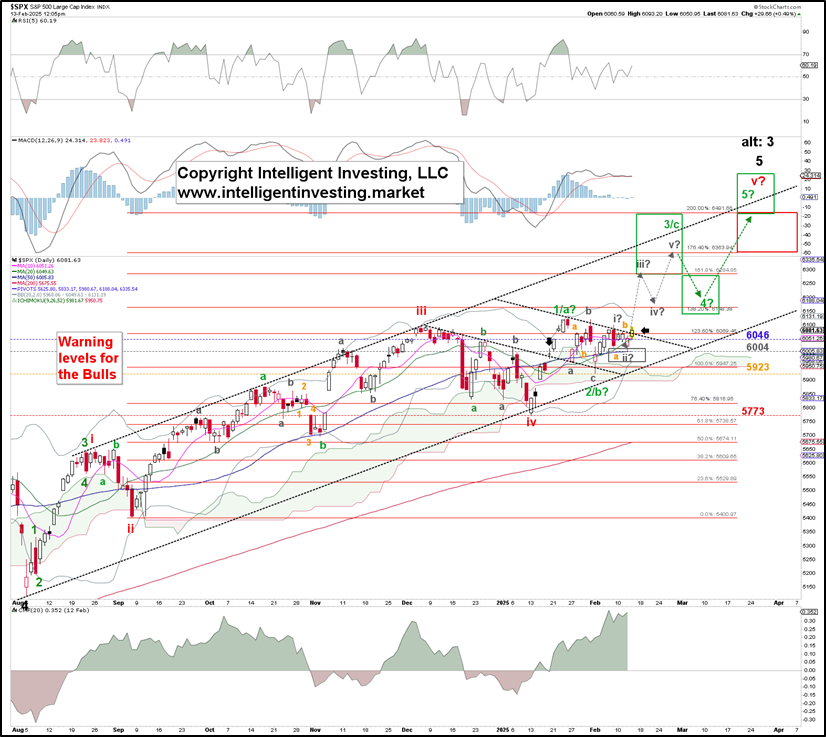
(Red) W-iii topped December 6 at $6099, and W-iv bottomed out on January 13 at SPX5773. See Figure 1 below. Continuing along this path, we showed in our previous update that the index should ideally top around $6125-6150 for a (green) W-1/a, drop to $5930-6000 for a (green) W-2/b, and then start a rally to $6300-6365 for green W-3/c.
Fast-forward: The index peaked at $6128 on January 24. Thanks to two debacles (DeepSeek and Tariffs), it dropped in a complex pattern called an expanded flat in EWP terms to $5923 by February 3. Now, it trades in the $6080s once again. See Figure 1 below.
Figure 1. Preferred Elliott Wave Principle count for the SP500
Thus, with an accuracy of around ±2%, we continue to reliably anticipate using the EWP where the index should top and bottom well ahead of time. Of course, we cannot know the exact path the market will take, as the daily price action is the least reliable. Still, foreseeing the most crucial top and bottom zones well ahead of time and before most is invaluable.
Therefore, our preferred view remains unchanged, as the market has not invalidated it. The index should now be in the grey W-iii of the green W-3/c, ideally to ~$6285, followed by the grey W-iv and W-v, at $6175 and ~$6365, respectively. At that latter level, the market can decide if the red W-v has topped or wants to tag on one last (green) W-4, 5 sequence. Besides, the index is A) above all our warning levels for the Bulls and B) above its rising 10-day simple moving average (d SMA), which is above the rising 20d SMA > 50d SMA > Ichimoku Cloud > 200d SMA. Thus, the chart shows a 100% bullish trend, so we must keep our bullish stance until proven otherwise.
What would that be? A break below the third (orange) warning level—the February 3 low at $6003, for starters, but ultimately, the January 13 low at $5773 remains the Bull-Bear line in the sand. If the market decides to move below these levels, our preferred EW count is wrong. But that’s our alternative, our insurance.
Thus, our Elliott Wave analysis provides specific levels to watch. How the market reacts to those combined with the structure of that reaction will tell us how to adjust if needed, aka “all we can do is anticipate, monitor, and adjust if necessary.” Currently, our preferred EW count remains on track. We’re simply monitoring its progress to see if it aligns with the market’s price action. If yes, stay long and keep monitoring. If not, adjust and take appropriate trading action.
However, once the $6300+ region has been reached, a much larger correction can start, if not an outright multi-year Bear market.
Author

Dr. Arnout Ter Schure
Intelligent Investing, LLC
After having worked for over ten years within the field of energy and the environment, Dr.


