S&P 500 update: Is a pullback brewing?

In our previous update from July 11, we anticipated, based on continued alignment of average post-election seasonality, with the Elliott Wave (EW) Principle, that the SP500 (SPX) would
“peak (green W-3/c) around July 16 to reach roughly $6380-6460, [find] a low (green W-4) on July 21 reaching around $6025+/-100, with the upper end preferred, and a final high around August 2 (green W-5) at approximately $6815+/-100.”
Although the previous June alignment worked perfectly, the index overlooked July's movement and simply rallied nonstop. We can call that miss “60% of the time it works every time,” which is common in financial markets. No big deal, since the index never dropped below our key warning levels of $6177 and $6061 set back then, so we stayed long comfortably. However, now that the $6380-6460 zone has been reached, and since price is the ultimate judge—though timing can sometimes help—the index is in a range where a pullback is more likely to start.
Figure 1. Our preferred short-term Elliott Wave count
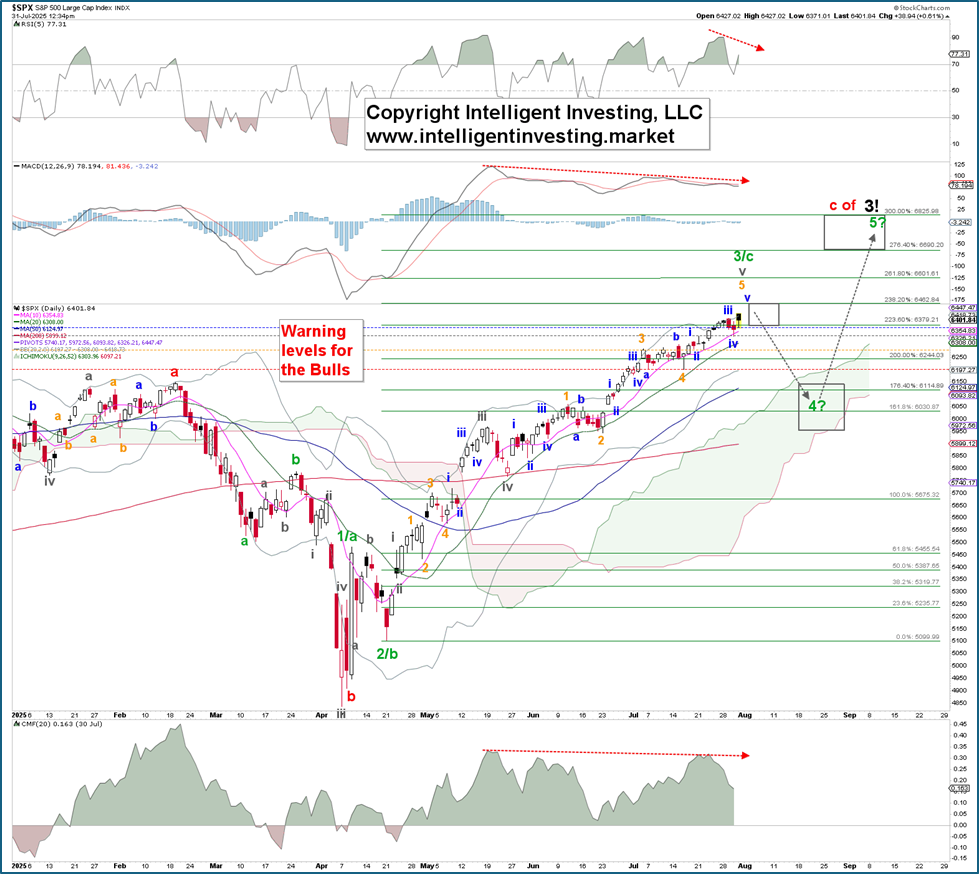
As the SPX rose over the past three weeks, we have increased the daily warning levels as follows: 1st, blue, warning at 6363; 2nd, grey, warning at 6336; 3rd, orange, warning at 6281; 4th, final warning (red) at 6201, to indicate whether that pullback is starting. As of today, there is no sign that it is.
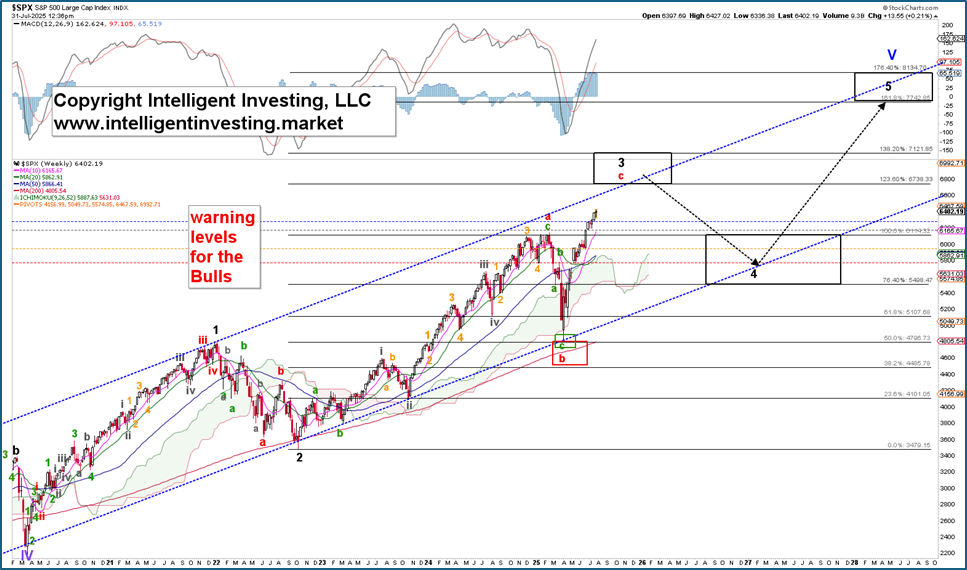
Based on the current waves, the $6690-6820 zone for the potential green W-5, which is an extended fifth wave target, falls within our long-standing third wave target range of $6738-7121. See Figure 2 below. This target range is derived from the 123.6-138.2% extension of the black W-1 (March 2020 to January 2021 rally), measured from the black W-2 low (October 2022). The W-3 target zone is typical for an ending diagonal (ED), as we consider the rally since the March 2020 low to be a significant (blue) Primary W-V ED.
Figure 2. The SPX weekly chart with our preferred EW count
Thus, as the stock market ignored post-election year seasonality in July, we must recognize that it is an average pattern and not set in stone. Besides, as stated, if the index does not move below our critical warning levels, it reserves the right to subdivide higher, as it has done over the last three weeks. This is why we always say “all we can do is anticipate, monitor, and adjust if necessary.”
However, the index has now reached the ideal extended green W-3 target zone, where a pullback is more likely to occur. But we need to see the price close at least below $6336 to give the green W-4, ideally $6025+/-100, a strong chance of success, while keeping an eye on the bigger picture, as the larger 3rd wave target zone has yet to be reached.
Author

Dr. Arnout Ter Schure
Intelligent Investing, LLC
After having worked for over ten years within the field of energy and the environment, Dr.


