S&P 500 (SPX), Nasdaq (NDX QQQ) chart levels to watch, technical analysis overview
- S&P 500 remains bullish as it recaptures short-term moving averages.
- Nasdaq (QQQ) still lagging, but strong support at 13,000-12,800.
- Why fight the Fed, just buy the dips!

Bears briefly came out of hibernation last week as a shocking CPI rekindled their hopes of an inflaionary spiral and consequential equity sell-off. However their hopes were swiftly extinguished by a plethora of Fed speakers touting the company line that all is going to plan and the unsaid "Don't fight the Fed" mantra.
S&P 500 (SPX, SPY) forecast
The little wobble after the CPI release last week is now looking more and more like the perfect time to buy the dip. This is the trade of the last decade. Pretty much since the financial crisis when global central banks decided to go on a bond buying shopping spree. It has not paid to short against central banks many times in history (although Soros might disagree), and it looks likely that trend will continue. Many investors and traders (including myself) are strongly concerned that a large bubble is being inflated with these increasing central bank purchases. But for now the trend is too strong to argue with, so traders and investors must trade price and what is in front of them and not what they perceive should be in front of them.
The reality is a period of extraordinary central bank stimulus, strong economic growth, strong employment growth and strong demand. If this sounds like a reason to be bearish, then go ahead and manage the risk.
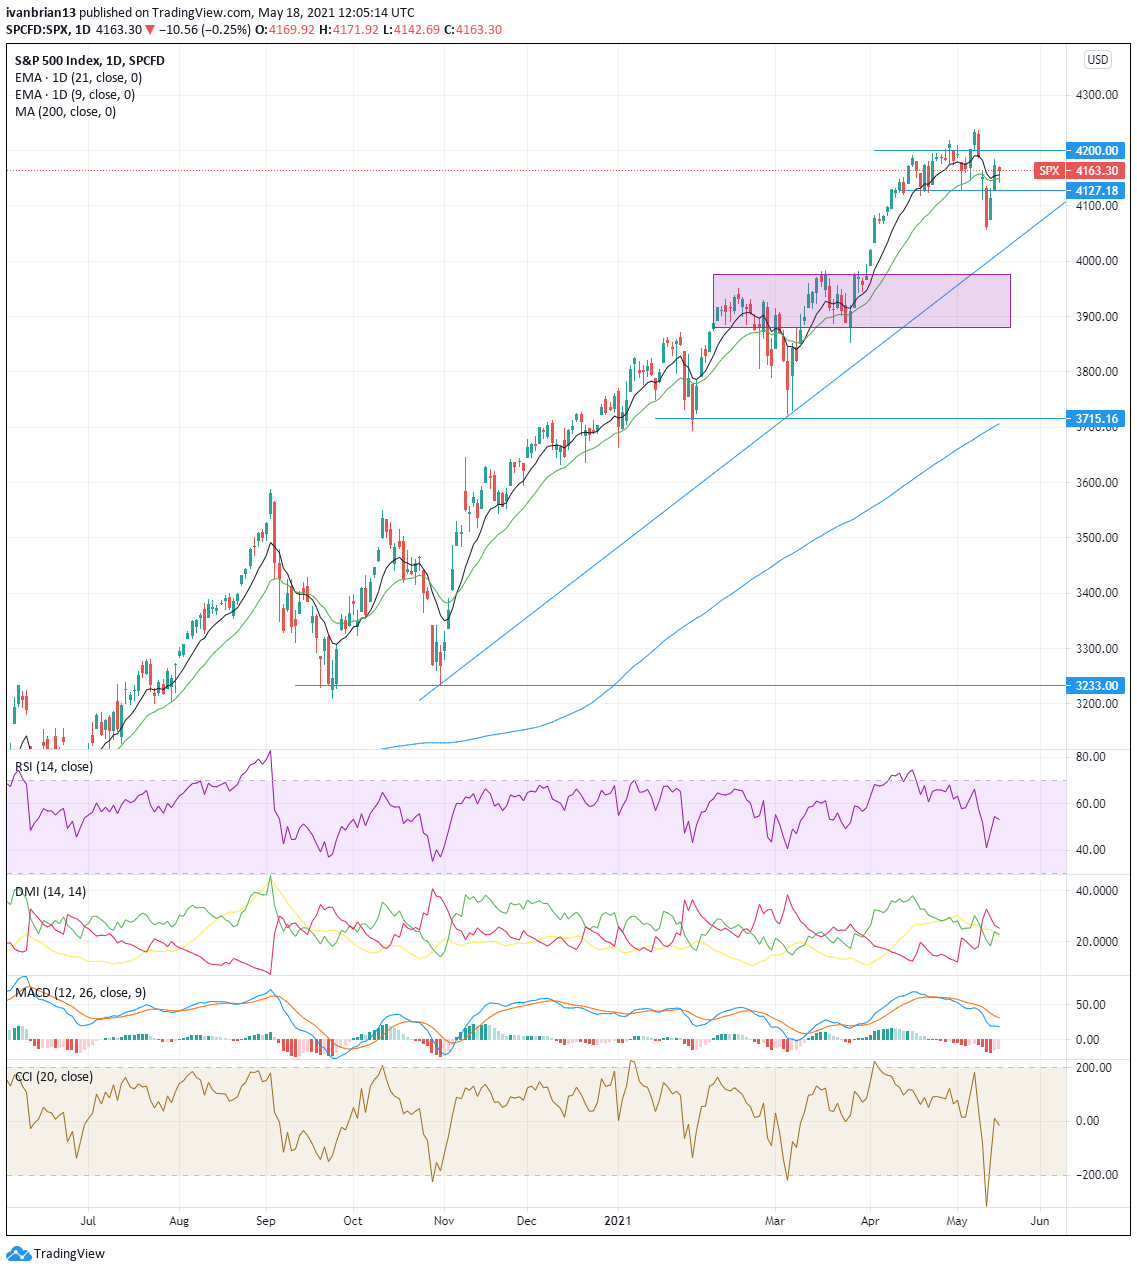
The S&P 500 remains poised now for a push to new highs. To do so, it needs to hold the 4,127 support before testing 4,200 resistance. Once through 4,200, it should not find much resistance to take out highs at 4,238.
Any retracement should see strong support come into play at 3,900. This is a consolidation region from early 2021 when the S&P exhibited a very similiar wobble before discarding it and powering higher. The bullish tone is intact all the way until 3,715. A break here will not only break lows from March and January but also take out the key 200-day moving average.
| Support | 4127 | 4017 trendline | 4000 | 3981 | 3878 | |
| Resistance | 4200 | 4238 |
Nasdaq (QQQ NDX) forecast
The Nasdaq has been more suspicious of the bulls seen in other indices and has retraced the most after the CPI shock. This happened despite many of its constituents not actually having heavily discounted cash flows, which would be further discounted by higher interest rates. The Fed continues to make it clear that higher interest rates do not require extra thought. The big tech names are highly cash generative and are more akin to growth and value combined rather than speculative high growth stocks.
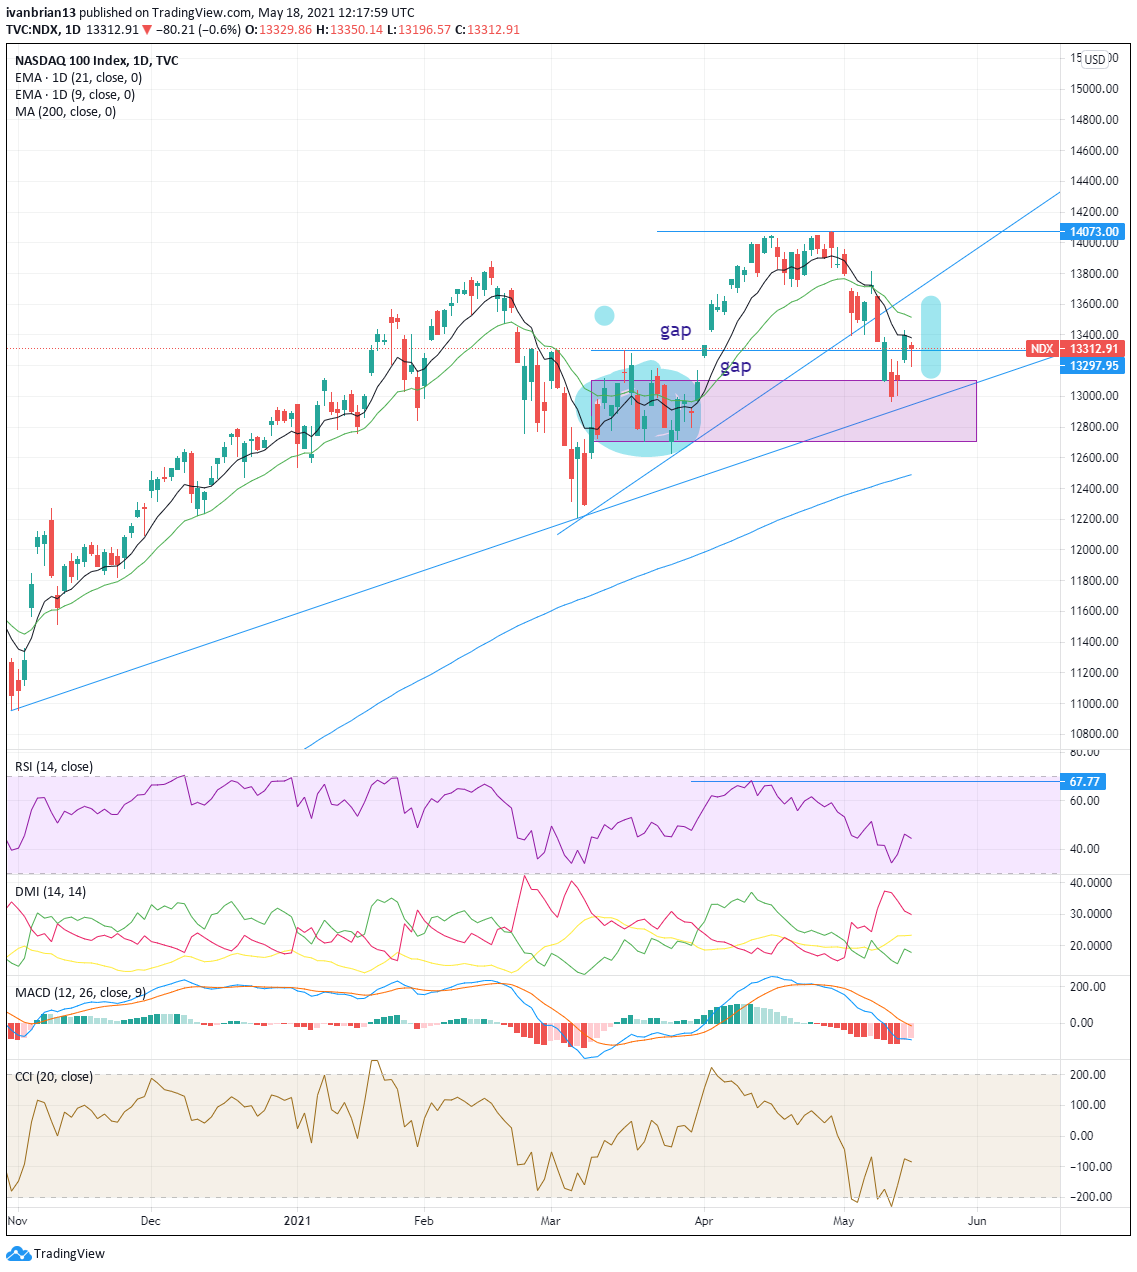
The post-CPI sell-off brought the Nasdaq into a very strong support region from 12,800-13,000. This is a consolidation area from March and April. A trend line support comes into play at 12,980, and the 200-day moving average sits just below at 12,500. The Relative Strength Index (RSI) and Commodity Channel Index (CCI) are both in neutral territory. Both indicators did not match the high seen on April 29, giving a bearish divergence.
The key level to hold above is 13,297 before it breaks the 9-day moving average at 13,381. Breaking above 13,780 fills a small vacuum and should see a break of new highs above 14,073.
| Support | 13,100 | 13,000 | 12,980 trendline | 12,500 200-day | |
| Resistance | 13,297 | 13,381 9-day | 13,780 | 14,073 |
At the time of writing, the author has no position in any stock mentioned in this article and no business relationship with any company mentioned. The author has not received compensation for writing this article, other than from FXStreet.
This article is for information purposes only. The author and FXStreet are not registered investment advisors and nothing in this article is intended to be investment advice. It is important to perform your own research before making any investment and take independent advice from a registered investment advisor.
FXStreet and the author do not provide personalized recommendations. The author makes no representations as to accuracy, completeness, or the suitability of this information. FXStreet and the author will not be liable for any errors, omissions or any losses, injuries or damages arising from this information and its display or use. The author will not be held responsible for information that is found at the end of links posted on this page.
Errors and omissions excepted.
Author

Ivan Brian
FXStreet
Ivan Brian started his career with AIB Bank in corporate finance and then worked for seven years at Baxter. He started as a macro analyst before becoming Head of Research and then CFO.


