|premium|

S&P 500 (SPX) flatlines before nonfarm payrolls

  • Nonfarm payrolls for November arrive on Friday.
  • PCE data supports the Fed pause theory.
  • Bond yields price a lower terminal Fed rate below 5%.

US equities held up well on Thursday with little profit-taking evident. The strong move on Wednesday after Powell's speech was consolidated as the major indices remained nearly flat for most of the session. The NASDAQ correctly outperformed due to the continued fall in interest rates as markets priced in a peak Fed funds rate of about 4.9%, down from 5% only a few weeks ago. This is perhaps curious given Powell and others have stated they see peak rates being higher than the September forecast, but bond markets are betting on a 2023 recession to keep a lid on rate hikes. This naturally boosts the rate-sensitive NASDAQ. The situation in China is helping some of the big tech names, notably Apple (AAPL) and Tesla (TSLA), which overall is helping all indices. Oil prices recovering have pushed oil stocks higher, and the energy sector also stabilized on Thursday after dropping Wednesday.

S&P 500 news

Asian equities fell as profit-taking was evident after some strong rallies this week. All eyes now turn to the nonfarm payrolls release from the US. Expectations are set at 200K jobs, which would add to Fed pause hopes with slowing evident. Anything higher could prove difficult for risk assets to make gains. Overall, a tight balance is evident as too much of a slowdown will add to recession fears after yesterday's weak ISM data. Below 50K would put the reading in the recession zone. 

S&P 500 (SPX) forecast

Technically, the S&P 500 remains bullish above 4,030, which is the double top from November. The break above has now added fuel to the rally, and as long as we remain above this level the risk reward is skewed higher in my opinion. Friday, however, is the next hurdle with the jobs report. Extended resistance is to 4,325, the summer high. This would be a strong resistance and a real test if we are in a longer-term bear market. 
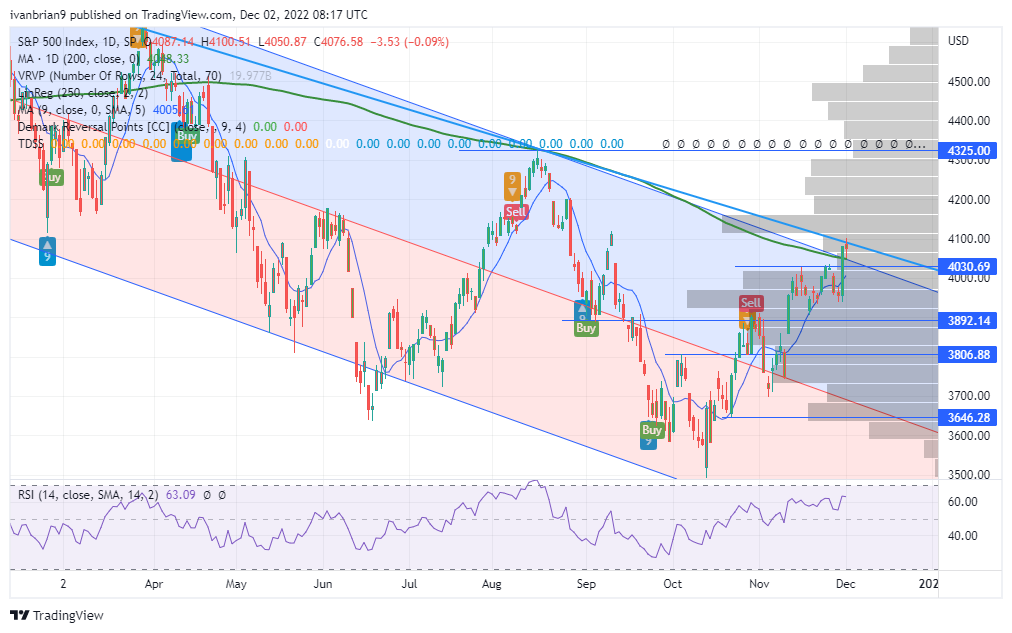
SPX daily chart

Premium

You have reached your limit of 3 free articles for this month.

Start your subscription and get access to all our original articles.

Subscribe to PremiumSign In

Author

Ivan Brian

Ivan Brian

FXStreet

Ivan Brian started his career with AIB Bank in corporate finance and then worked for seven years at Baxter. He started as a macro analyst before becoming Head of Research and then CFO.

More from Ivan Brian
Share:

Editor's Picks

AUD/USD eyes 0.7150 barrier nine-day EMA

AUD/USD inches higher after registering modest losses in the previous day, trading around 0.7130 during the Asian hours. The technical analysis of the daily chart indicates that the pair is moving sideways within the rectangle pattern, suggesting a consolidation as neither the bulls nor the bears have enough momentum to take control of the market.

USD/JPY trades below 160.00 intervention threshold; bullish bias intact

The USD/JPY pair attracts some sellers during the Asian session amid fears that authorities will step in again to prop up the Japanese Yen. Furthermore, the Israel-Lebanon truce prompts some profit-taking around the US Dollar and exerts downward pressure on the currency pair.

Gold defends 200-day SMA at $4,425, but for how long?

Gold is attempting a tepid recovery toward $4,500 early Thursday, as renewed optimism in the Mideast geopolitical front calms market nerves. This cautious optimism across Asian markets weighs on Oil prices, and diminishes the US Dollar’s safe-haven appeal, helping Gold stage a decent comeback from the weekly low of $4,424.


Hyperliquid: ETF demand, capital rotation fuel HYPE rally as Bitcoin melts

Hyperliquid price sustains an upward trend near its all-time high of $75.76 on Thursday after posting 80% gains in May, while Bitcoin (BTC) retraces below $65,000, triggering a market-wide panic.

Kevin Warsh takes the Fed helm: What it means for the US Dollar
The Federal Reserve moves away from the highly predictable "forward guidance" model of the Jerome Powell era to a new “Kevin Warsh environment”, characterized by less communication, more policy surprises, and an increased focus on the Fed's complex balance sheet.
Recession on paper: What really moves the Canadian Loonie now?

Statistics Canada handed the headline writers a gift and the analysts a headache. Real GDP shrank 0.1% on an annualized basis in the first quarter, and with the fourth quarter of 2025 revised down to a 1.0% contraction, that is two negative quarters in a row, the textbook definition of a technical recession and Canada's first since the pandemic.