S&P 500 Sep futures playbook – Alpha structure + Micro session roadmap

The daily Alpha structure is boxed between 6,481 and 6,153, inside a rising 3-month channel. The new micro grid shows sellers defending 6,469–6,500 and 6,451.75 (micro-5); acceptance below 6,401–6,406 replays July’s short 5→1 cascade, while a reclaim > 6,481 unlocks 6,544 → 6,810/6,873.
Executive summary
-
Alpha state: Four failed attempts at 6,481.50 led to a two-day pullback. The Alpha range remains 6,481 (upper) / 6,153 (base); the channel stays constructive while 6,153 holds.
-
Micro confirmation of the drop: The break at the daily pivot 6,481.50 occurred into weekly VAH/POC and within intraday pivots 6,500–6,469—the breaking point.
-
Two micro sequences played:
-
Short at micro-5 (6,451.75) – target micro-1 (≈6,406.75).
-
Failure to stabilise at micro-1/3 rolled to a lower micro-5 (≈6,401.25) – target micro-1/2 (≈6,368–6,356).
-
-
Heading into London: The tape is capped at 6,418.75/6,406.75. Line in the sand: the micro-5 band ~6,401–6,418.
-
Above 6,418.75 – rotate 6,428.50 – 6,438.00 – 6,451.75 / 6,469.25 – 6,500.50.
-
Below 6,401.25 – open 6,397.50 – 6,387.50 – 6,378.00 – 6,368.25 (micro-2) – 6,356.25 (micro-1) – 6,337.00.
-
-
Bigger unlocks:
-
> 6,481.50 and hold – 6,544.25 (channel cap), then 6,810 / 6,872.75.
-
Daily close < 6,153.00 – 5,887.25 – 5,824.50 (next Alpha nodes).
-
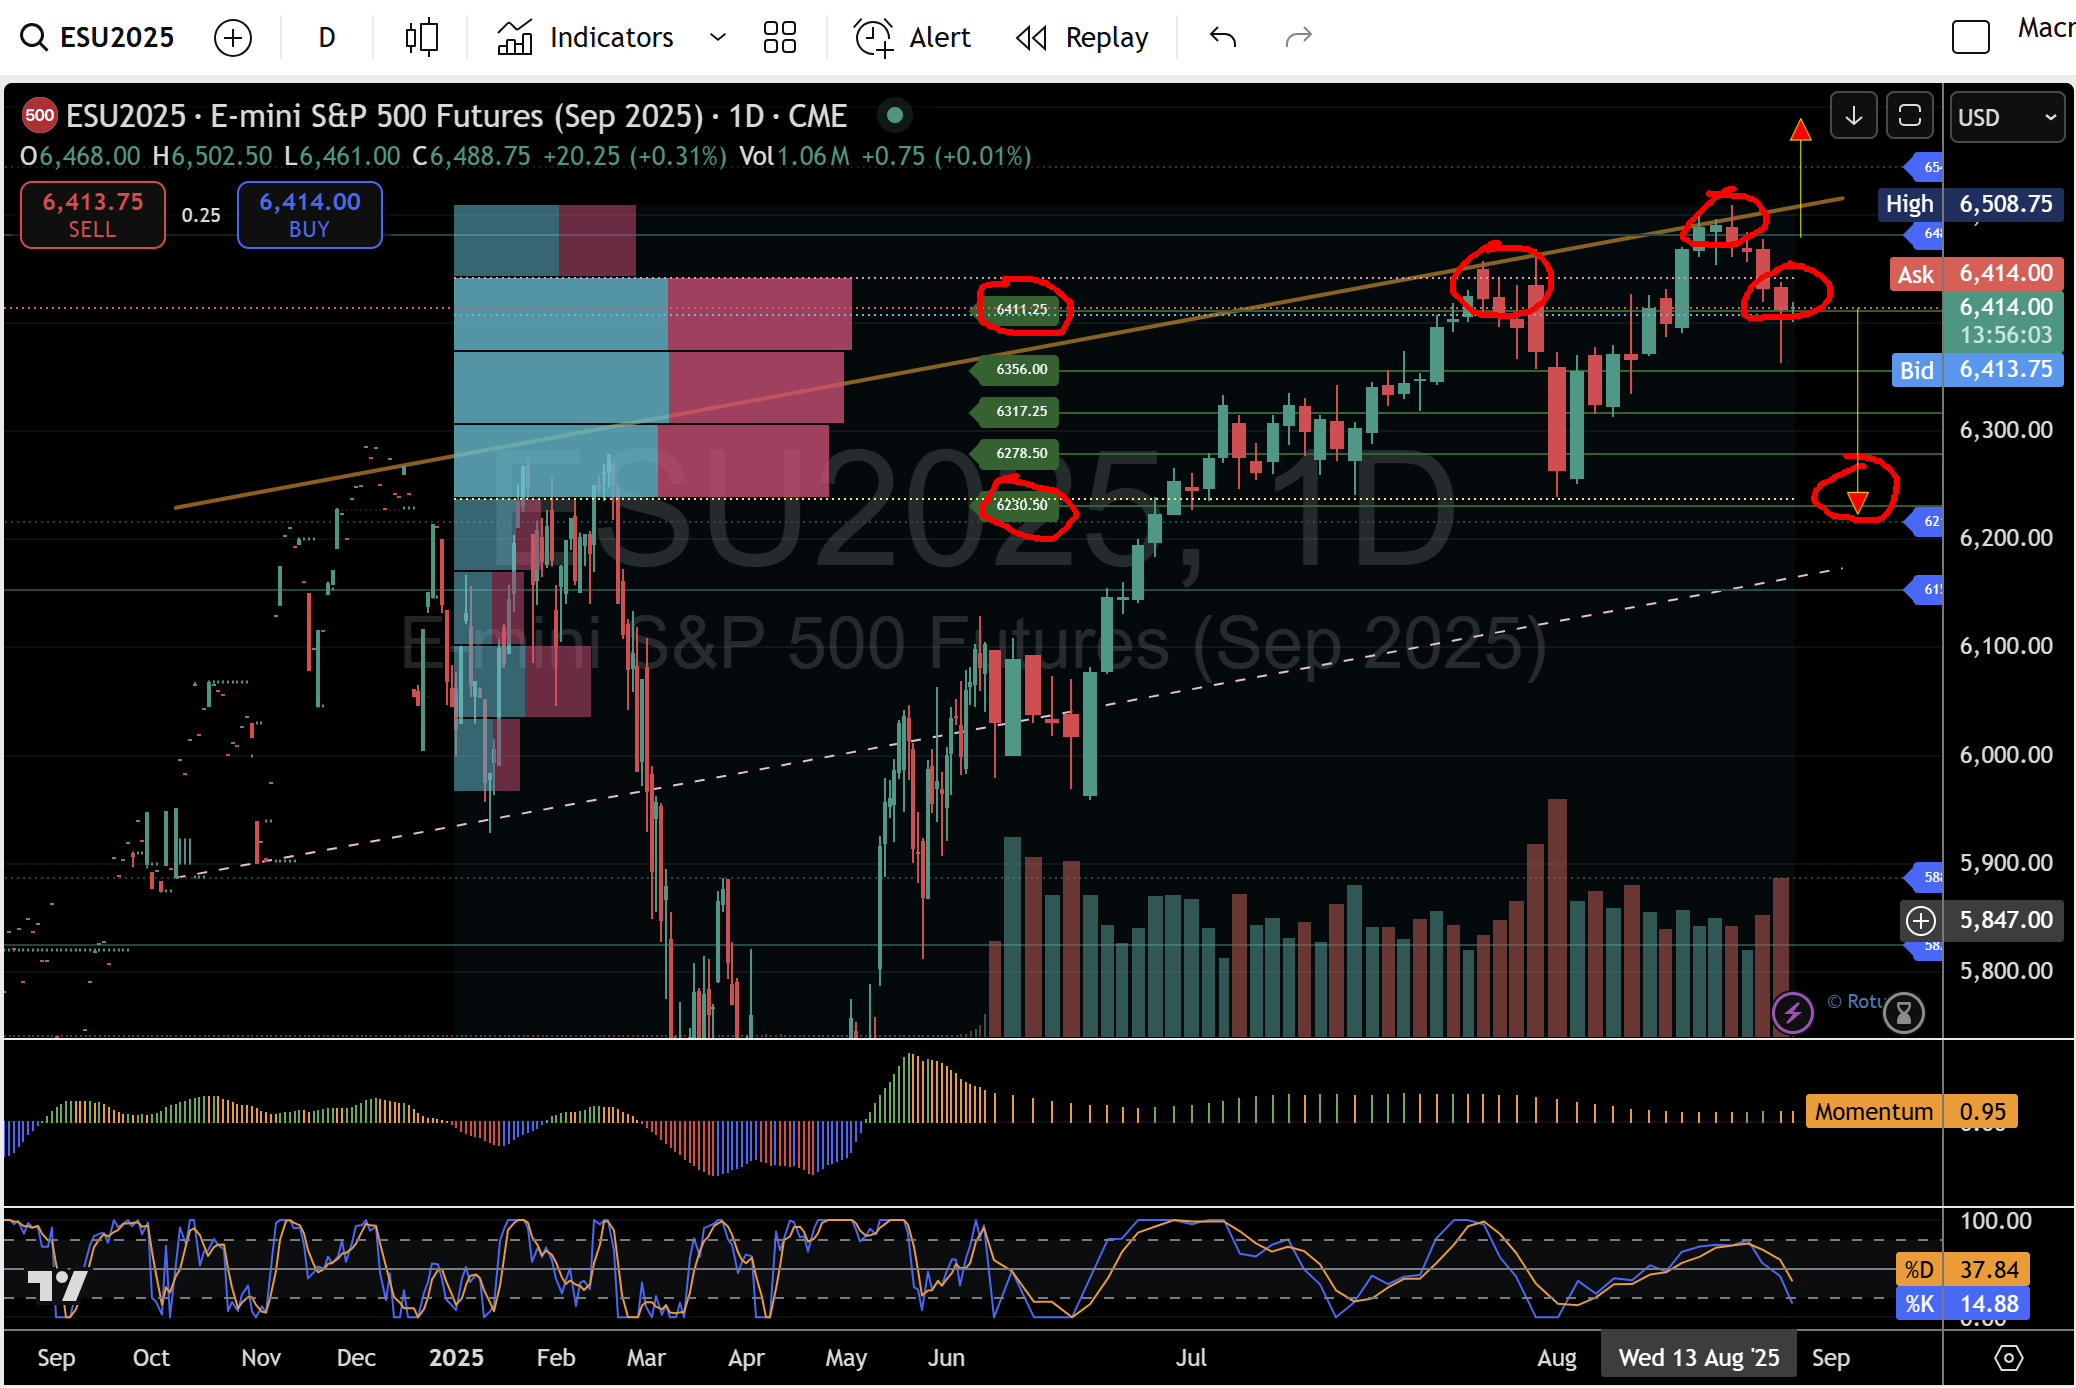
Daily Alpha price chart structure boxed between 6,481 and 6,153 August 20.
Alpha (daily) with micro overlay
- The Alpha box 6,481–6,153 remains the dominant map; repeated failure near 6,481 aligns with the upper channel / 6,544.25 supply.
- Overlaying micro grid shows micro-5 (≈6,411) sitting just under 6,481, creating fast rotations back to 6,411 after failed breakouts. Acceptance below 6,411 typically sequences 4→3→2→1—exactly what happened in the July pullback.
Daily triggers
- Bullish continuation: Reclaim/hold > 6,481.50 → 6,544.25 → 6,810 / 6,872.75.
- Range rotation (status quo): Fail again at 6,481–6,544 → rotate toward 6,215.75 → 6,153.00.
- Bearish violation: Daily close < 6,153 → 5,887.25 → 5,824.50 (risk of 5,687.75 / 5,621.50 if momentum accelerates).
London – New York micro playbook (forecast + execution)
Primary rules (our trading system):
- Longs only at micro-1 / micro-2 when structure + signals align (momentum ≥ 0).
- Shorts only at micro-5 / micro-4 when structure + signals align (momentum ≤ 0).
- No chase. If the entry’s gone, wait for the next re-test with confirmation.
- Invalidation: Close beyond the opposite micro band + loss of signal alignment.
Micro levels (from 5-minute chart)
- Top cluster/failure zone: 6,500.50 → 6,469.25 (beneath the daily pivot 6,481.50).
- Micro-5 band: ~6,401.25–6,418.75 (includes 6,406.75).
- Mid ladder: 6,428.50 / 6,438.00 / 6,451.75.
- Down ladder: 6,397.50 / 6,387.50 / 6,378.00 / 6,368.25 (micro-2) / 6,356.25 (micro-1) / 6,337.00.
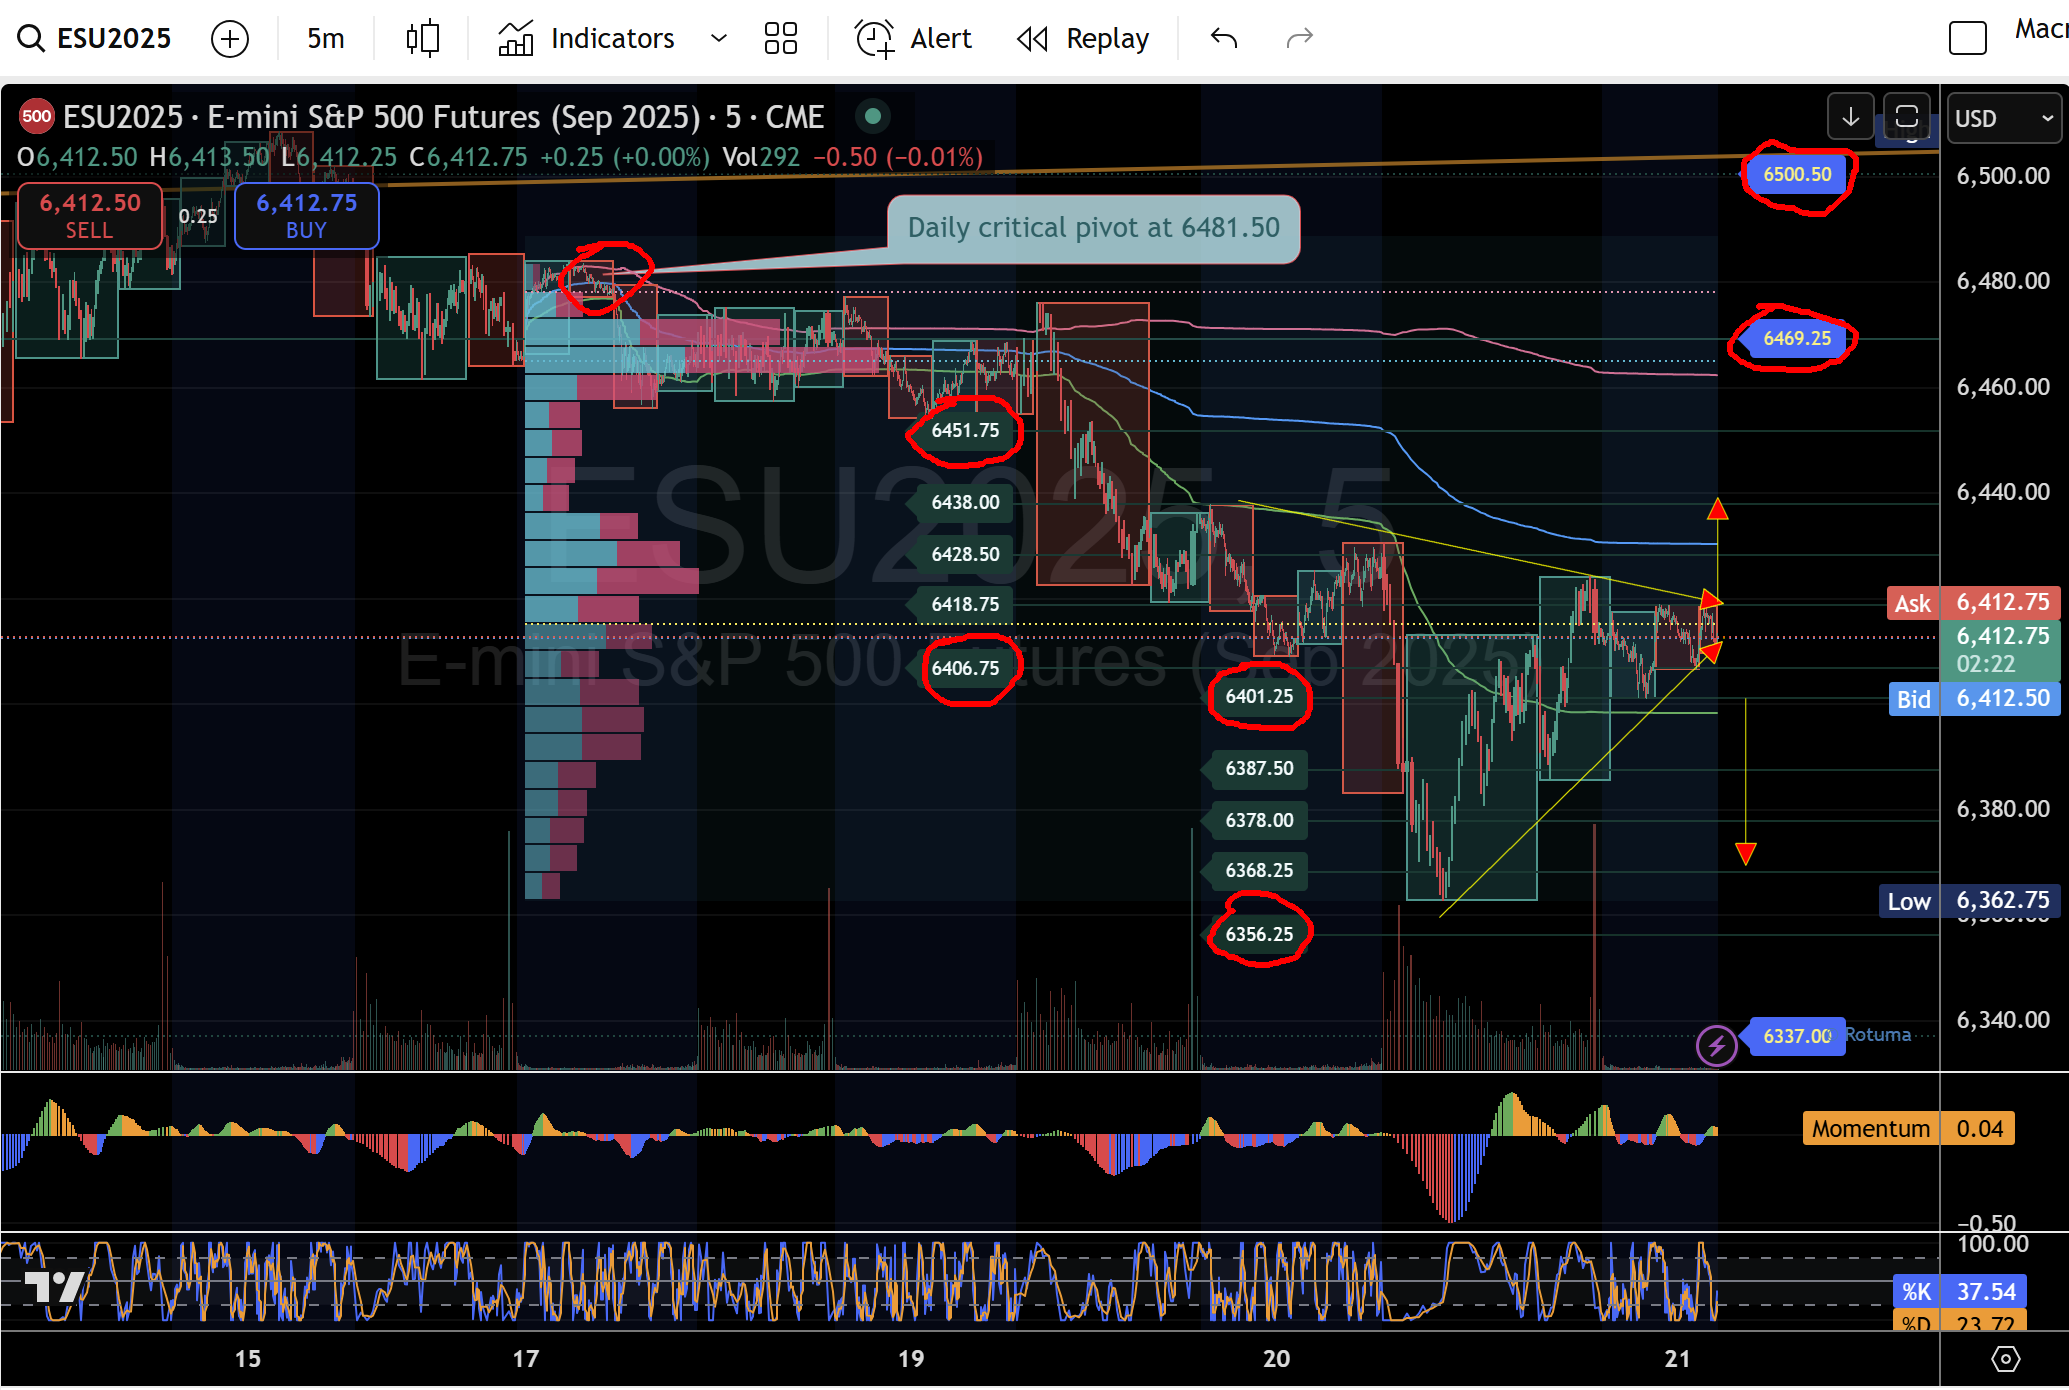
S&P 500 Sep futures intraday micro levels August 20.
Session scenarios
A) Trend-up day (requires reclaim):
- London/NY reclaim > 6,418.75 → hold pullbacks at 6,406–6,411 → drive 6,428.50 → 6,438.00 → 6,451.75 / 6,469.25.
- Acceptance above 6,481.50 turns the daily tape constructive → 6,544.25 next.
B) Rotational day (status-quo box):
- Rejections at 6,418–6,438 fade back to 6,406–6,401; failure to push beyond 6,451.75 keeps rotations tight.
- Trade the 5↔3 ping-pong, trim quickly, and avoid mid-air adds.
C) Trend-down /July replay:
- Lose 6,401.25 with momentum ≤ 0 → sequence 6,397.50 → 6,387.50 → 6,378.00 → 6,368.25 (micro-2) → 6,356.25 (micro-1).
- If 6,356 breaks, 6,337 is next; the daily map then points to 6,215.75 → 6,153.00.
Risk and management
- Place the initial stop beyond the opposite micro band; scale at the next micro and trail behind reclaimed pivots.
- Size down into data prints and avoid adding through squeeze spikes without fresh confirmation.
"This analysis is for educational purposes only and does not constitute investment advice. Futures trading involves substantial risk and may not be suitable for all investors. Always conduct thorough research and manage risk effectively."
Author

Denis Joeli Fatiaki
Independent Analyst
Denis Joeli Fatiaki possesses over a decade of extensive experience as a multi-asset trader and Market Strategist.


