S&P 500 News and Forecast: Debt deal agreement leaves market expecting rally
- S&P 500, NASDAQ 100 futures rose 0.3% on Monday.
- Biden and McCarthy say they have the votes to pass a debt deal.
- CrowdStrike, Lululemon, Broadcom and SalesForce report earnings.
- May jobs report comes out on Friday with Wall Street expecting a decline in employment growth.

The S&P 500 index begins this shortened week with a lightness in its step. Following the Memorial Day holiday on Monday, the market will open with the belief that US leadership will be able to pass a debt limit bill this week. President Joe Biden and House Speaker Kevin McCarthy said as much on Saturday, and they were quite confident that they had the votes despite negativity from certain fringes of the Republican Party. The vote needs to be passed before June 5, when Treasury Secretary Janet Yellen said the government will run out of money.
Separately, the market is looking ahead to Friday’s jobs report with analysts betting on a major climbdown in new hiring for May. Additionally, a number of major tech names unveil quarterly earnings on Wednesday and Thursday.
On Monday, S&P 500 and NASDAQ futures both advanced 0.3%.
S&P 500 News: Is the debt-ceiling fight over?
The debt limit compromise will limit some spending, and overall it is expected to have a deflationary impact. Some unspent funds from prior covid-related bills will be clawed back. Second, approximately a quarter of the new funding for the Internal Revenue Service (IRS) passed by Biden will be cut.
Non-defense discretionary spending will remain flat in the next fiscal year, and the student loan pause that began in the covid-era will end with the government expected to take in as much as $5 billion a month in payments. The resumption of student loan payments should buoy private student loan servicers like SoFi (SOFI), but analysts also say it might curtail consumer spending in the coming months.
Some members of both parties are already opposing the supposed debt compromise. Texas Republican Chip Roy heads up the largest faction opposing the bill. Additionally, some Democrats have signaled anger with provisions that require new work requirements for food subsidies to poor families.
Broadly speaking, however, both McCarthy and Biden spoke with confident tones over the weekend that the bill would pass the House. From there it needs to pass the Senate, which seems likely, before Biden can sign it into law.
As things stand, the House vote is expected on Wednesday. The market will likely be optimistic on Tuesday, but the passing of a debt compromise would take a major headwind away from markets, and most analysts think an equity rally is imminent this week.
Friday’s May jobs report could make Fed hike less likely
April’s 253,000 net new hires is expected to fall to 195,000 for May. The Nonfarm Payrolls figure, released by the Bureau of Labor Statistics on the first Friday of the month, would send unemployment up by 10 basis points to 3.5%. The consensus forecast also calls for average wages to grow by a 0.3% monthly pace rather than the 0.5% pace seen in April.
A downward pressure on jobs would make it more likely that the Fed decides to pause its rate hikes at the next meeting – held on June 13 and 14. That would obviously be bullish for stocks, so the market wants lowered employment readings for May. A higher reading would make it more likely that the Fed hikes by another 25 basis points. Currently, the CME FedWatch Tool shows 62% of the market expects a rate hike, while 38% expects a pause.
United States Nonfarm Payrolls
The Nonfarm Payrolls released by the US Bureau of Labor Statistics presents the number of new jobs created during the previous month in all non-agricultural businesses. The monthly changes in payrolls can be extremely volatile due to their high relation with economic policy decisions made by the Federal Reserve. The number is also subject to strong reviews in the upcoming months, and those reviews also tend to trigger volatility in the Forex board. Generally speaking, a high reading is seen as positive (or bullish) for the USD, while a low reading is seen as negative (or bearish), although previous months' reviews and the unemployment rate are as relevant as the headline figure, and therefore market's reaction depends on how the market assets them all. Read more.
Next release: Friday June 02, 2023 12:30:00 GMT
Frequency: Monthly
Source: US Bureau of Labor Statistics
Why it matters to traders?
America’s monthly jobs report is considered the most important economic indicator for forex traders. Released on the first Friday following the reported month, the change in the number of positions is closely correlated with the overall performance of the economy and is monitored by policymakers. Full employment is one of the Federal Reserve’s mandates and it considers developments in the labor market when setting its policies, thus impacting currencies. Despite several leading indicators shaping estimates, Nonfarm Payrolls tend to surprise markets and trigger substantial volatility. Actual figures beating the consensus tend to be USD bullish.
Tuesday and Friday are both mostly quiet on the earnings front, but Wednesday and Thursday could see more volatility with big companies reporting. SalesForce (CRM) and CrowdStrike (CRWD) will be closely watched on Wednesday, while Broadcom (AVGO) and Lululemon Athletica (LULU) are the major events of Thursday.
Earnings of the week
Tuesday, May 30 - HP (HPQ),
Wednesday, May 31 - CrowdStrike (CRWD), SalesForce (CRM), Chewy (CHWY)
Thursday, June 1 - Asana (ASAN), Broadcom (AVGO), MongoDB (MDB), Lululemon Athletica (LULU), Dell Technologies (DELL), Zscaler (ZS), PagerDuty (PD)
What they said about the S&P 500 and the stock market
Analysts at Société Génerale analyzes the technical scenario for the S&P 500 index, pointing at key resistance and support levels in the short term:
S&P 500 Index is heading towards last August high of 4320 which is also close the 61.8% retracement of the whole decline during 2022. In case the move falters around this level, an initial pullback is not ruled out however upper end of previous range at 4200/4180 should be first layer of support.
– SocGen
Charlie Munger, vice chairman of Berkshire Hathaway (BRK) and right-hand man to Warren Buffet, told The Financial Times over the weekend that a mild recession should be expected in the US since US banks are holding lots of commercial real estate loans that are now underwater. Lack of new lending would then cause the downturn in the economy.
"Every bank in the country is way tighter on real estate loans today than they were six months ago.”
S&P 500 FAQs
What is the S&P 500?
The S&P 500 is a widely followed stock price index which measures the performance of 500 publicly owned companies, and is seen as a broad measure of the US stock market. Each company’s influence on the computation of the index is weighted based on market capitalization. This is calculated by multiplying the number of publicly traded shares of the company by the share price. The S&P 500 index has achieved impressive returns – $1.00 invested in 1970 would have yielded a return of almost $192.00 in 2022. The average annual return since its inception in 1957 has been 11.9%.
How are companies chosen to be included in the S&P 500?
Companies are selected by committee, unlike some other indexes where they are included based on set rules. Still, they must meet certain eligibility criteria, the most important of which is market capitalization, which must be greater than or equal to $12.7 billion. Other criteria include liquidity, domicile, public float, sector, financial viability, length of time publicly traded, and representation of the industries in the economy of the United States. The nine largest companies in the index account for 27.8% of the market capitalization of the index.
How can I trade the S&P 500?
There are a number of ways to trade the S&P 500. Most retail brokers and spread betting platforms allow traders to use Contracts for Difference (CFD) to place bets on the direction of the price. In addition, that can buy into Index, Mutual and Exchange Traded Funds (ETF) that track the price of the S&P 500. The most liquid of the ETFs is State Street Corporation’s SPY. The Chicago Mercantile Exchange (CME) offers futures contracts in the index and the Chicago Board of Options (CMOE) offers options as well as ETFs, inverse ETFs and leveraged ETFs.
What factors drive the S&P 500?
Many different factors drive the S&P 500 but mainly it is the aggregate performance of the component companies revealed in their quarterly and annual company earnings reports. US and global macroeconomic data also contributes as it impacts on investor sentiment, which if positive drives gains. The level of interest rates, set by the Federal Reserve (Fed), also influences the S&P 500 as it affects the cost of credit, on which many corporations are heavily reliant. Therefore, inflation can be a major driver as well as other metrics which impact the Fed decisions.
S&P 500 forecast: A fragile new high
The S&P 500 closed up just above 4,200 last Friday. The close at 4,205 means a new range high for the index, surpassing the high on February 2. Now it is a straight shot to the August 16, 2022, range high at 4,325. A bad sign for the week will be if the S&P 500 index ends any session back below 4,200.
The Moving Average Convergence Divergence (MACD) is quite uncertain at the moment. Despite the new high, the indicator looks like it could easily turn south with the slighted bit of doubt in the markets.
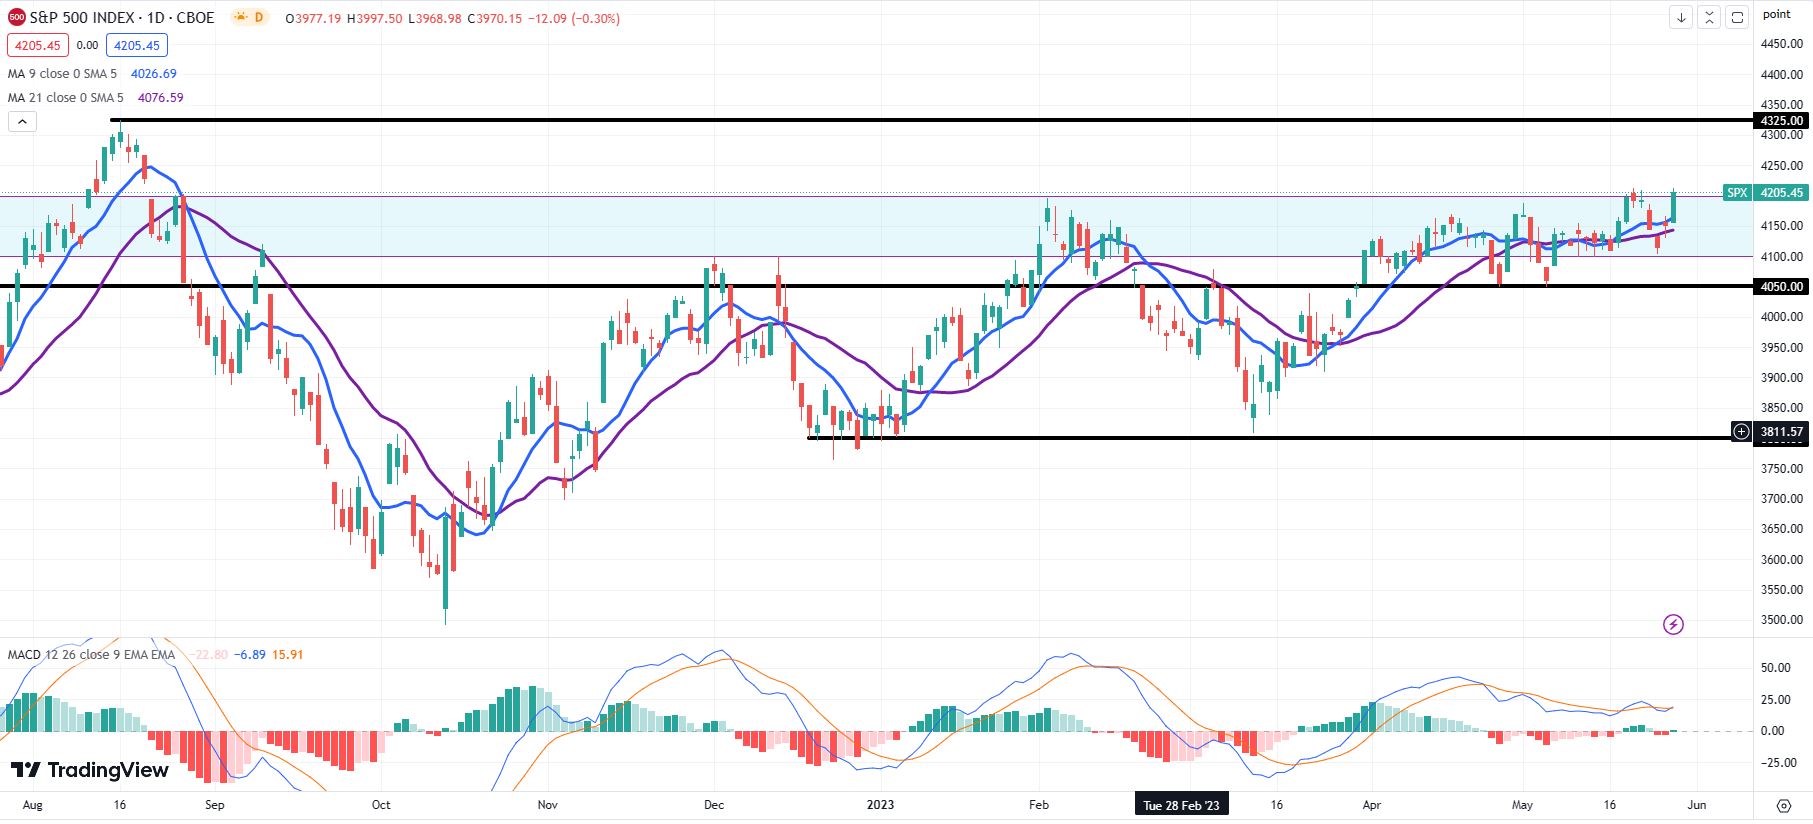
S&P 500 daily chart
Premium
You have reached your limit of 3 free articles for this month.
Start your subscription and get access to all our original articles.
Author

Clay Webster
FXStreet
Clay Webster grew up in the US outside Buffalo, New York and Lancaster, Pennsylvania. He began investing after college following the 2008 financial crisis.


