S&P 500: New highs or consolidation ahead?

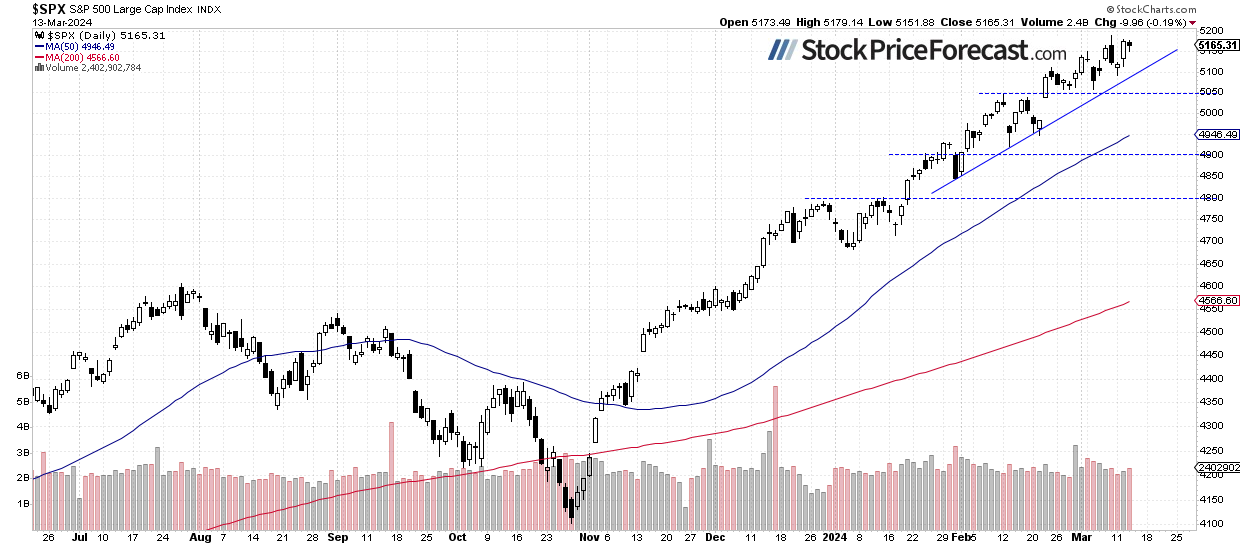
Wednesday’s trading session didn’t bring much change for the stock market. On Tuesday, the S&P 500 gained 1.1%, and yesterday, it lost 0.19%, extending a consolidation below its last Friday’s record high of 5,189.26. So, the question is: will stocks break higher and reach new all-time highs? This morning, the S&P 500 futures contract is trading 0.2% higher following a higher-than-expected Producer Price Index release (it came in at +0.6% vs. expected +0.3% m/m), accompanied by worse-than-expected Retail Sales data. It’s indicating a slightly higher opening for the S&P 500 index today.
On March 1, I mentioned about February, “Despite concerns about stock valuations, the market rallied to new record highs, fueled by hopes of the Fed's monetary policy pivot and the AI revolution.”. And yet, it was the same story again last week. However, on Friday, a much more pronounced profit-taking occurred. Nevertheless, on Tuesday and yesterday, the S&P 500 went closer to its record high again.
While indexes were hitting new record highs, most stocks were essentially moving sideways. So, the question is – is this a topping pattern before a more meaningful correction? Still, there have been no confirmed negative signals; however, one might consider the possibility of a trend reversal.
Recently, the stock market continued to rally, fueled by advances in a handful of tech sector stocks, but as I wrote on February 7, “We may have to deal with a correction or consolidation of several weeks of advances. With the season of quarterly earnings announcements coming to an end and a series of important economic data, profit taking may follow.” Despite last week’s new record, this still holds true. Nevertheless, such volatility complicates short-term market predictions.
The investor sentiment remained elevated yesterday; the AAII Investor Sentiment Survey showed that 45.9% of individual investors are bullish, while only 21.9% of them are bearish. The AAII sentiment is a contrary indicator in the sense that highly bullish readings may suggest excessive complacency and a lack of fear in the market. Conversely, bearish readings are favorable for market upturns.
The S&P 500 index is still trading above an over month-long upward trend line, as we can see on the daily chart.
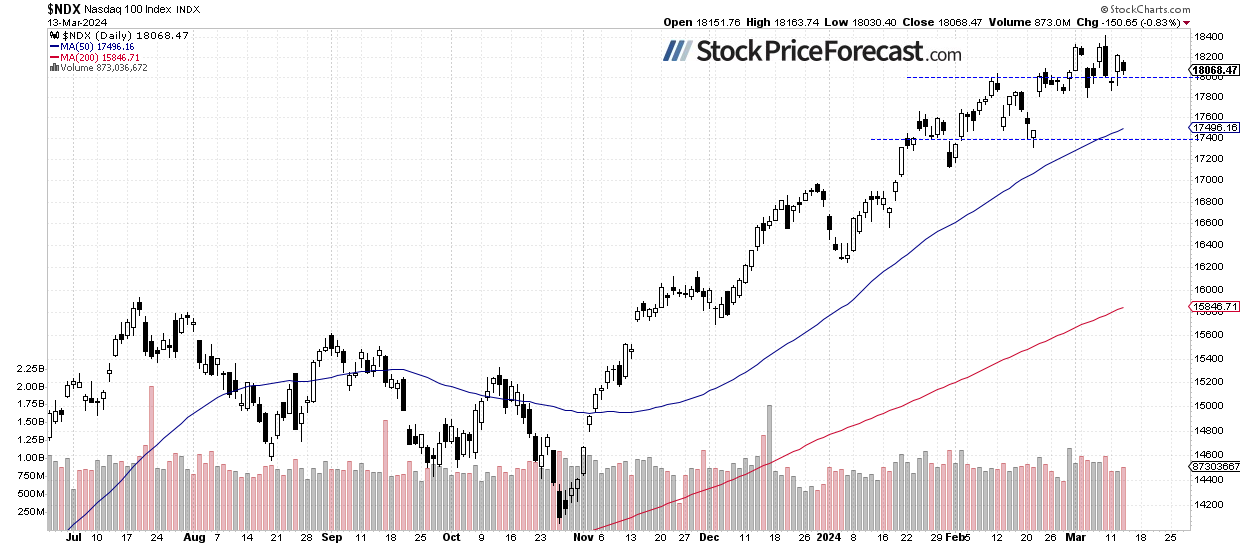
Nasdaq 100 remains above 18,000
The technology-focused Nasdaq 100 index reached a new record high of 18,416.73 on Friday, before retracing most of the advance and extending fluctuations along the 18,000 level. It still looks like a consolidation following a multi-month rally.
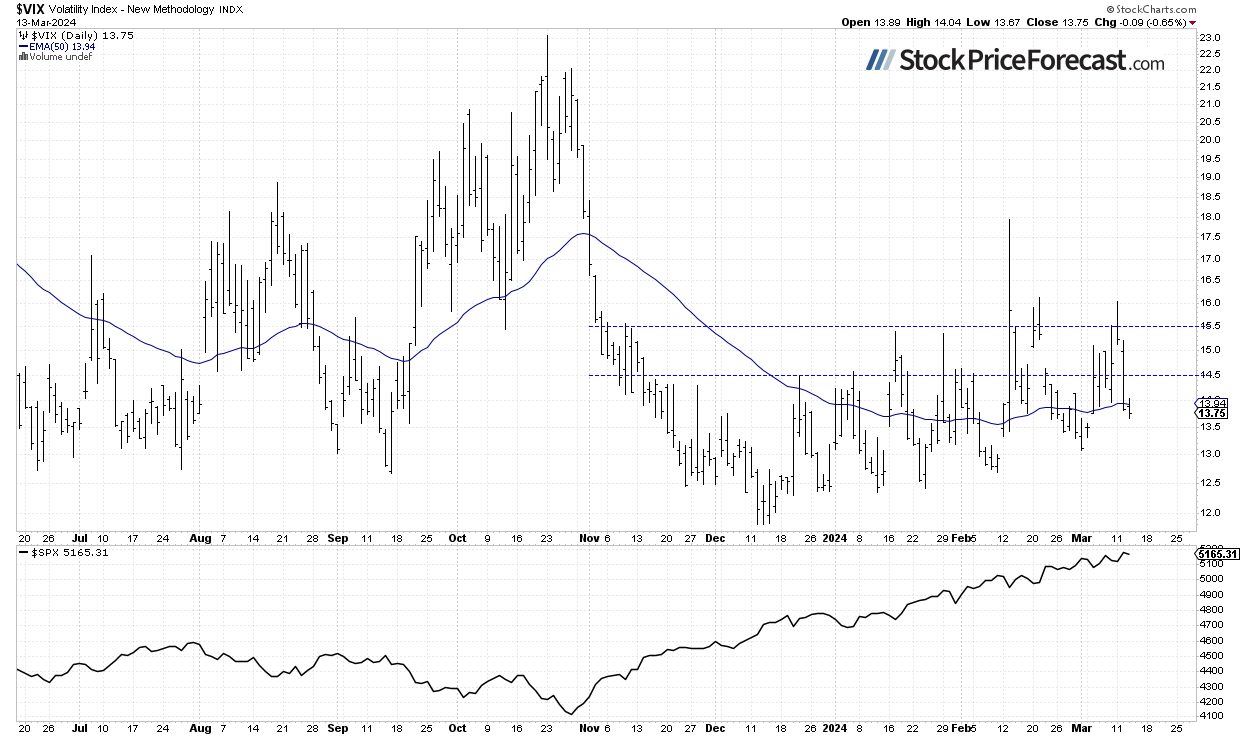
VIX remains below 14 again
The VIX index, also known as the fear gauge, is derived from option prices. In the middle of last week, it remained elevated despite new records for the indexes, and on Monday, it reached as high as 16 as stock prices kept retracing their recent advances. On Tuesday and yesterday, the VIX dropped below 14 as stocks retraced their declines.
Historically, a dropping VIX indicates less fear in the market, and rising VIX accompanies stock market downturns. However, the lower the VIX, the higher the probability of the market’s downward reversal.
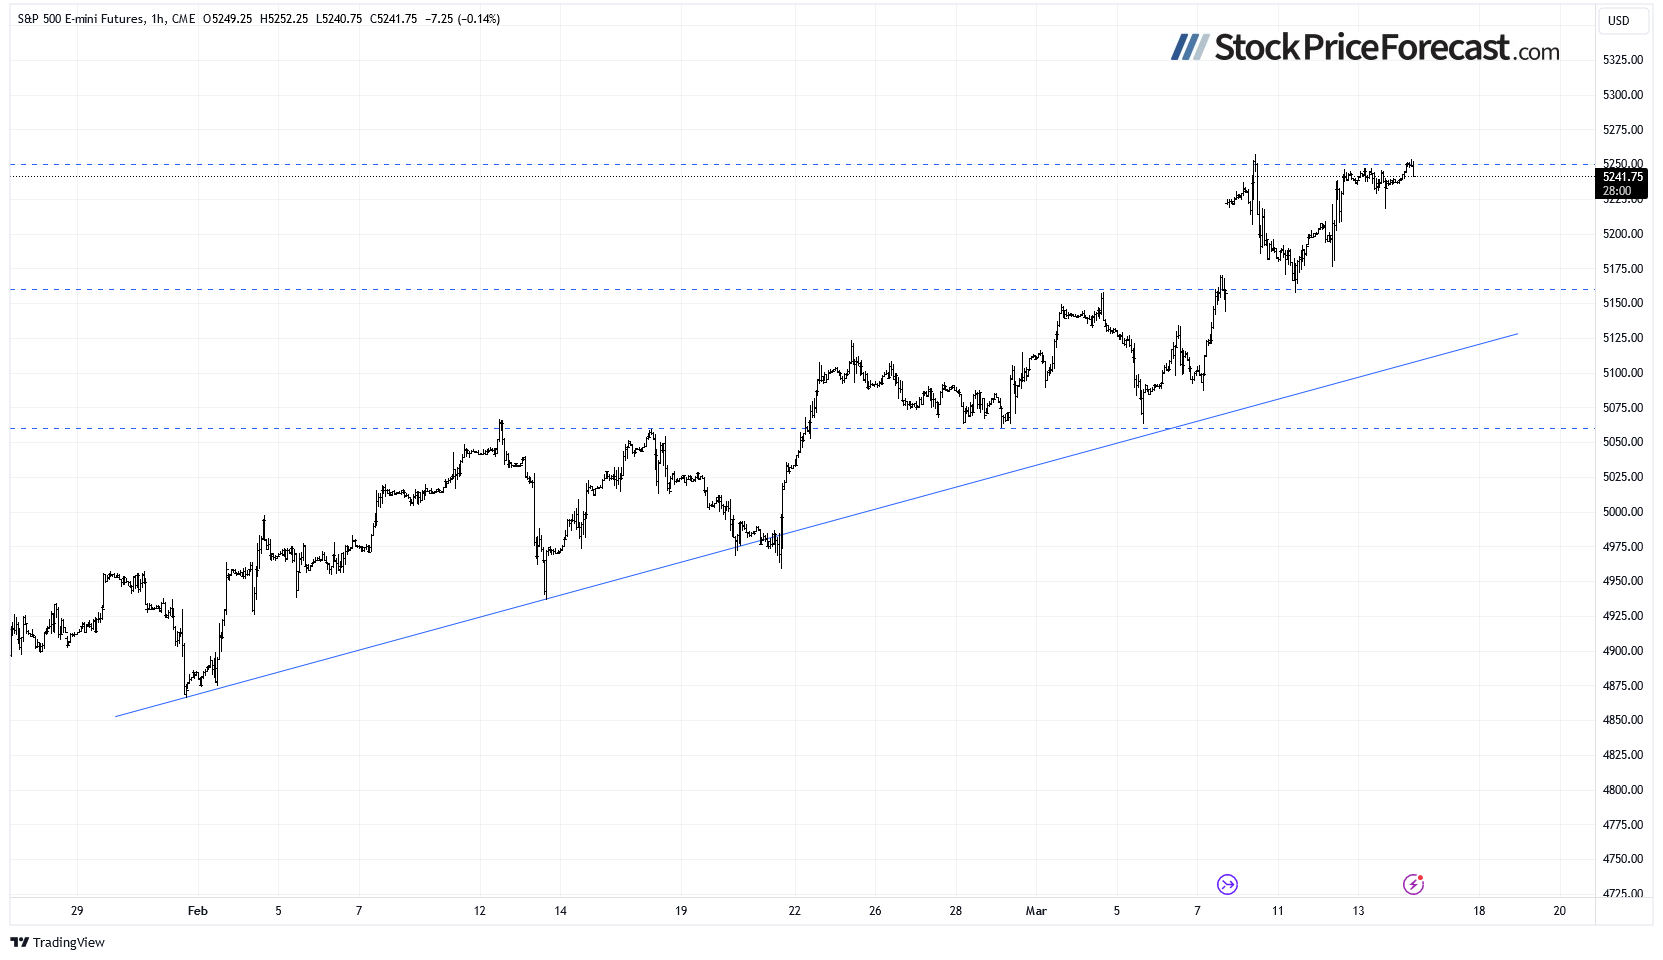
Futures contract remains close to record high
Let’s take a look at the hourly chart of the S&P 500 futures contract. It’s still trading very close to the record high of around 5,260. On the other hand, the support level is now at 5,200-5,220.
Conclusion
The recent trading action was very bullish, with some of the tech stocks rallying to new record highs, the S&P 500 index breaking above 5,100, and the Nasdaq 100 index reaching above the 18,000.
Today, the S&P 500 index is likely to open slightly higher after a series of mixed economic data. Last Tuesday, I wrote that “The most likely scenario is an extended consolidation at some point, as not all stocks are participating in the rally, and it's driven by a handful of AI-connected ones.” Despite late last week’s record-breaking advance, it remains a probable scenario.
In my Stock Price Forecast for March, I noted “So far, stock prices have been trending upwards in the medium to long term, reaching new record highs. The prudent advice one could give right now is to remain bullish or stay on the sidelines if one believes stocks are becoming overvalued and may need a correction. It's likely that the S&P 500 will continue its bull run this month. However, we may encounter a correction or increased volatility at some point as investors start to take profits off the table.”
For now, my short-term outlook remains neutral.
Here’s the breakdown:
-
The S&P 500 is likely to remain near a record high this morning, but there's a possibility of a profit-taking action at some point.
-
It still appears to be consolidating within an uptrend.
-
In my opinion, the short-term outlook is neutral.
Want free follow-ups to the above article and details not available to 99%+ investors? Sign up to our free newsletter today!
Want free follow-ups to the above article and details not available to 99%+ investors? Sign up to our free newsletter today!
Author

Paul Rejczak
Sunshine Profits
Paul Rejczak is a stock market strategist who has been known for the quality of his technical and fundamental analysis since the late nineties.


