S&P 500 kicks off 2024 with a bearish tone on Tuesday, slips back towards $4,700
- Tuesday drew the S&P’s rally to a sharp end as risk appetite reverses direction.
- Equities were largely dragged lower by poor showings in tech stocks.
- US data turns red once again, crimping investor confidence.

The Standard & Poor’s (S&P) 500 major equity index closed Tuesday sharply lower after falling just short of making all-time highs in December. Risk appetite reversed course and turned sharply lower to kick off 2024, drawing the S&P’s recent rally to a quick close as investors pulled back on US economic data misses.
US equities closed out 2023 with a stall in the recent stock rally which helped close out the year with firm gains across major indexes, with the S&P etching in a nine-straight-week upside swing before sinking back on Tuesday as overextended market flows pull back.
The S&P 500 declined over half of a percent on Tuesday, closing down 27 points at $4,742.83. The tech-heavy NASDAQ saw the largest losses on the day, slipping over 1.6% to close at $14,765.94, down nearly 250 points. The Dow Jones Industrial Average (DJIA) stumped Tuesday’s risk-off flows, closing marginally flat at $37,715.04, rising a scant 0.07% to close 25.5 points higher.
Tech stocks led the charge down the charts as investors pulled back from tech darling Apple (AAPL), which shed 4% on the day following disappointing demand for their latest products, leading Barclay’s to downgrade their outlook on AAPL.
The US S&P Global Manufacturing PMI missed the mark on Tuesday, declining to a four-month low of 47.9 in December versus the market forecast of a steady print of 48.2. Economic data continues to soften in the US, increasing the risk of a “soft landing” economic scenario that threatens to crimp growth and hobble employment, but the Fed will need a bigger push on the inflation front before rates can start coming down.
Wednesday’s US ISM Manufacturing PMI is expected to improve from 46.7 to 47.1 for December, and markets will be keeping a close eye on the Fed’s latest Meeting Minutes due to publish at 19:00 GMT. Investors will be tearing open the Open Market Committee’s latest minutes to try and draw a bead on how steeply Fed policymakers are leaning towards rate cuts, with some particularly eager market participants anticipating the next rate-cutting cycle to begin as soon as March.
2024’s first trading week will wrap up with US Nonfarm Payrolls (NFP), slated for Friday. December’s NFP is expected to show US jobs additions easing back slightly from 199K to 168K.
NFP watchers will first have to survive the midweek hump, with ISM Manufacturing and the Fed’s latest Meeting Minutes releasing on Wednesday, followed by Thursday’s ADP Employment Change and Initial Jobless Claims for the week ending December 29.
S&P 500 Technical Outlook
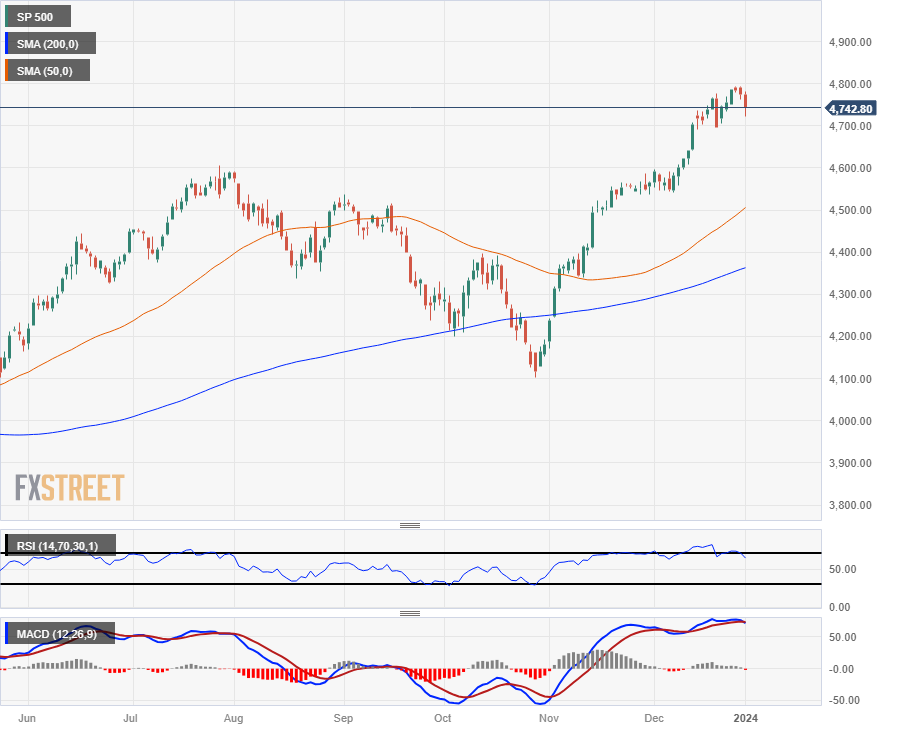
Despite Tuesday’s bearish 2024 kickoff, the S&P remains firmly entrenched in bull country, trading within reach of fresh all-time-highs beyond $4,814.68, and it would take an 8% decline before the major equity index even reached the 200-day Simple Moving Average (SMA) near $4,363.
$4,600 remains a key technical barrier, providing a technical floor for any extended downturns with the 50-day SMA rising into $4,500 to provide additional technical support.
S&P 500 Daily Chart
S&P 500 Technical Levels
Author

Joshua Gibson
FXStreet
Joshua joins the FXStreet team as an Economics and Finance double major from Vancouver Island University with twelve years' experience as an independent trader focusing on technical analysis.


