SP 500 index Elliott Wave technical analysis [Video]
![SP 500 index Elliott Wave technical analysis [Video]](https://editorial.fxstreet.com/images/Markets/Equities/display-panel-of-daily-stock-market-59908972_XtraLarge.jpg)
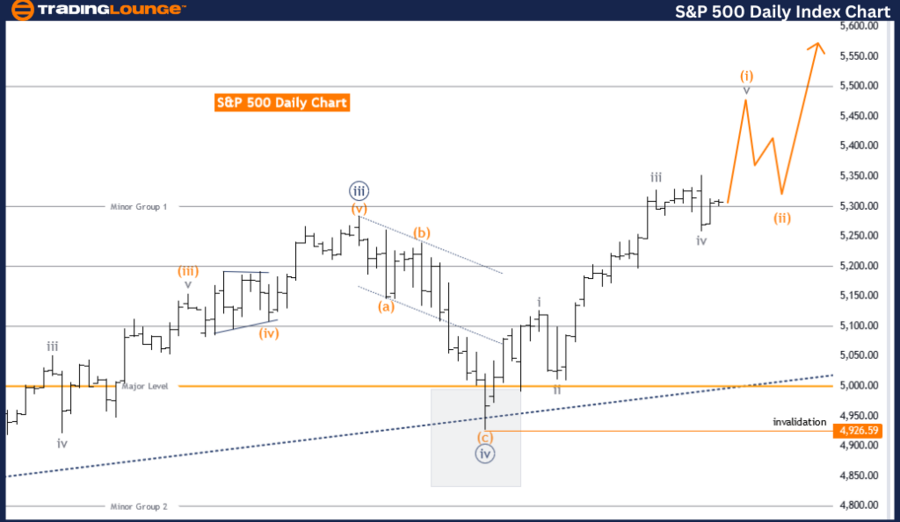
S&P 500 Elliott Wave Analysis Trading Lounge Day Chart,
S&P 500 Elliott Wave technical analysis
Function: Trend.
Mode: Impulsive.
Structure: Gray wave 5.
Position: Orange wave 1.
Direction next lower degrees: Orange wave 2.
Details: Gray wave 4 looking completed, now gray wave 5 of orange wave 1 is in play.
Wave Cancel invalid level: 4926.59.
The S&P 500 Elliott Wave Analysis on the daily chart focuses on a trend that is described as impulsive. The primary structure currently observed is gray wave 5, which is situated within the context of orange wave 1. This analysis suggests that following the completion of the current wave, the next anticipated movement will be orange wave 2.
According to the details provided, gray wave 4 appears to have been completed, which sets the stage for gray wave 5 of orange wave 1 to be actively in play. The analysis emphasizes an important invalidation level at 4926.59. If the price reaches or exceeds this level, the current wave structure would be deemed invalid, necessitating a reevaluation of the wave count.
The Elliott Wave Principle, which underpins this analysis, is a form of technical analysis that identifies patterns in market cycles and predicts future market trends by understanding investor psychology and collective behavior. In this context, the S&P 500 daily chart reveals an ongoing impulsive wave (gray wave 5) following the completion of a corrective phase (gray wave 4).
The position of orange wave 1 within the broader structure implies that after the completion of gray wave 5, the market is expected to enter a corrective phase, identified as orange wave 2. The critical level of 4926.59 serves as a crucial marker; reaching this level would invalidate the current wave structure, indicating the need to reassess the wave analysis.
In summary, the S&P 500 analysis on the daily chart provides a detailed and structured outlook on the market's expected movements based on Elliott Wave principles. The current focus is on the progression and completion of gray wave 5 within orange wave 1, with significant attention paid to the invalidation level to ensure the accuracy of the wave count and subsequent market predictions. This meticulous approach helps traders anticipate potential market trends and make informed trading decisions.
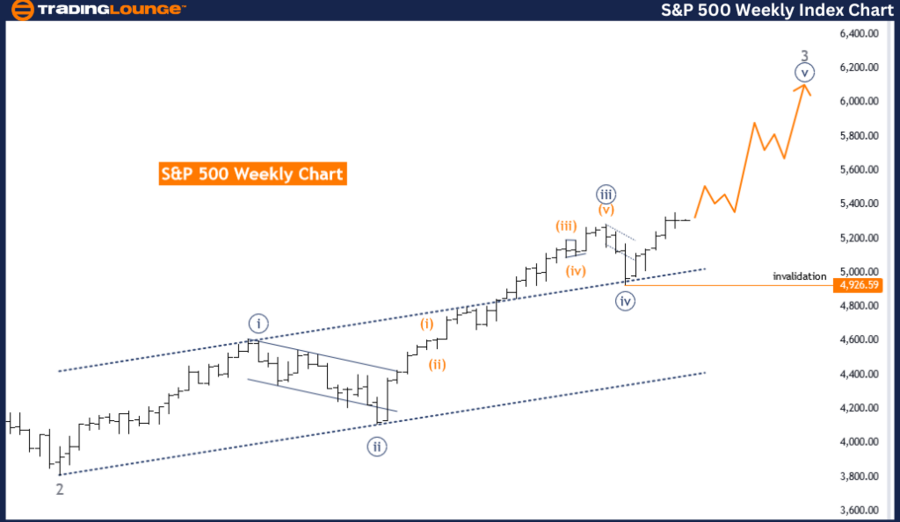
S&P 500 Elliott Wave Analysis Trading Lounge Weekly Chart,
S&P 500 Elliott Wave technical analysis
Function: Trend.
Mode: Impulsive.
Structure: Navy blue wave 5.
Position: Gray wave 3.
Direction next lower degrees: Gray wave 4.
Details: Navy Blue Wave 4 looking completed at 4926.59, now Navy Blue Wave 5 is in play. Wave Cancel invalid level: 4926.59.
The S&P 500 Elliott Wave Analysis on the weekly chart highlights a trend characterized by an impulsive mode. The primary structure currently under observation is navy blue wave 5, which is positioned within gray wave 3. Following this wave, the next anticipated movement is gray wave 4, suggesting a potential upcoming corrective phase.
The details of the analysis indicate that Navy Blue Wave 4 appears to have been completed at the level of 4926.59. This completion marks the transition to navy blue wave 5, which is currently in play. An important aspect of this analysis is the invalidation level set at 4926.59. If the market price reaches or surpasses this level, it would invalidate the current wave structure and necessitate a reassessment of the wave count.
The Elliott Wave Principle, which forms the basis of this analysis, is a widely-used technical analysis tool that seeks to predict future market trends by identifying recurring patterns in market cycles. In the context of the S&P 500 weekly chart, the current focus is on the progression of navy blue wave 5 within gray wave 3. The completion of navy blue wave 4 signals a shift to the final impulsive wave in this cycle before the market is expected to enter the corrective phase identified as gray wave 4.
This analysis provides traders and investors with a structured outlook on the S&P 500’s potential future movements. By identifying key waves and their positions, the analysis helps in understanding the market's direction and making informed trading decisions. The critical invalidation level of 4926.59 serves as a safeguard, ensuring that if the market moves contrary to the predicted wave pattern, adjustments can be made promptly to account for new market conditions.
In summary, the S&P 500 Elliott Wave Analysis on the weekly chart offers a detailed insight into the market’s trend. With navy blue wave 4 completed and navy blue wave 5 currently in play, traders should be prepared for the subsequent corrective phase of gray wave 4. Monitoring the invalidation level is crucial to maintaining the accuracy and reliability of the wave analysis.
Technical analyst: Malik Awais.
S&P 500 Elliott Wave technical analysis [Video]
Author

Peter Mathers
TradingLounge
Peter Mathers started actively trading in 1982. He began his career at Hoei and Shoin, a Japanese futures trading company.


