|

S&P 500 ETF (SPY) advances with nested structure in wave (five) [Video]

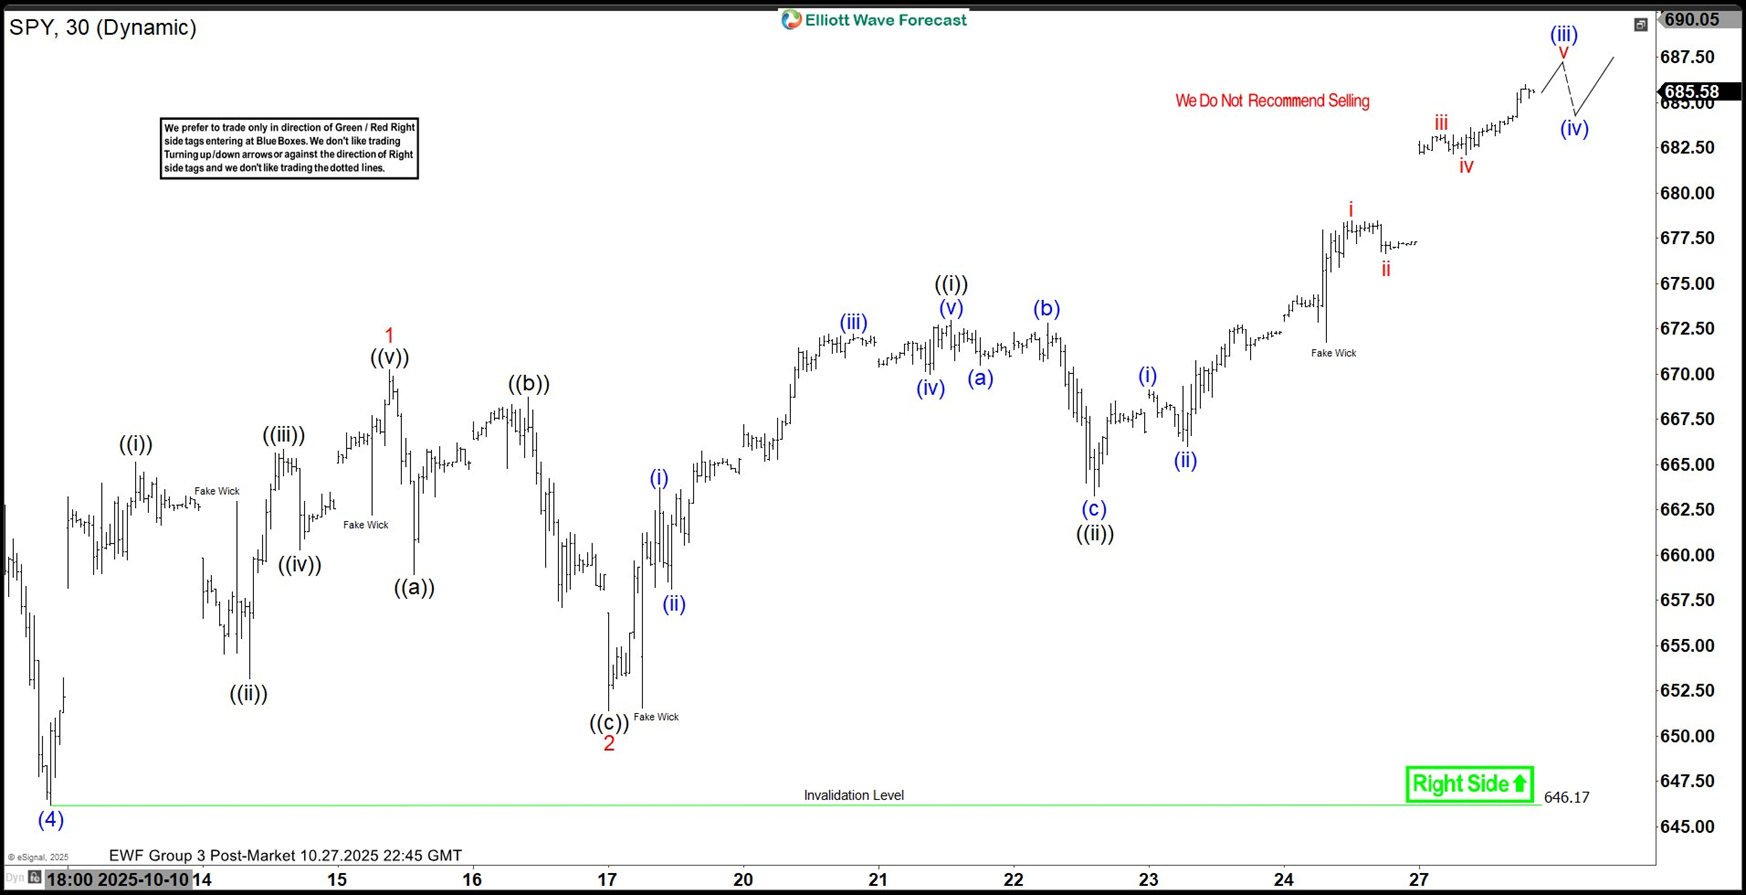
The short-term Elliott Wave analysis for the S&P 500 ETF (SPY) indicates an ongoing bullish cycle that began at the April 2025 low, unfolding as a five-wave impulse structure. As shown in the 30-minute chart, wave (4) of this impulse concluded at 646.17. The final leg, wave (5), is currently underway, characterized by an internal five-wave structure with nested subdivisions. From wave (4), wave ((i)) peaked at 665.13, followed by a pullback in wave ((ii)) to 653.17. Wave ((iii)) then advanced to 665.83, with a subsequent dip in wave ((iv)) to 660.28. The final wave ((v)) reached 670.23, completing wave 1 on a higher degree.

Subsequently, the ETF corrected in wave 2, forming a zigzag Elliott Wave pattern that bottomed at 651.41. From wave 1’s peak, wave ((a)) declined to 658.93, followed by a rally in wave ((b)) to 668.71. Wave ((c)) then dropped to 651.41, finalizing wave 2. The ETF has since resumed its upward trajectory in wave 3. From wave 2’s low, wave ((i)) climbed to 672.99, and wave ((ii)) dipped to 663.30. In the near term, anticipate a pullback finding support in a 3, 7, or 11 swing against 646.17, setting the stage for further upside. This analysis suggests continued bullish momentum with well-defined support levels guiding the next moves.

S&P 500 ETF (SPY) latest 30-minutes Elliott Wave chart from 10.28.2025

SPY Elliott Wave [Video]

Author

Elliott Wave Forecast Team

Elliott Wave Forecast Team

ElliottWave-Forecast.com

More from Elliott Wave Forecast Team
Share:

Markets move fast. We move first.

Orange Juice Newsletter brings you expert driven insights - not headlines. Every day on your inbox.

By subscribing you agree to our Terms and conditions.

Editor's Picks

EUR/USD clings to small gains near 1.1750

Following a short-lasting correction in the early European session, EUR/USD regains its traction and clings to moderate gains at around 1.1750 on Monday. Nevertheless, the pair's volatility remains low, with investors awaiting this weeks key US data releases and the ECB policy announcements.

GBP/USD edges higher toward 1.3400 as traders await key data and BoE

GBP/USD reverses its direction and advances toward 1.3400 following a drop to the 1.3350 area earlier in the day. The US Dollar struggles to gather recovery momentum as markets await Tuesday's Nonfarm Payrolls data, while the Pound Sterling holds steady ahead of the BoE policy announcements later in the week.

Gold climbs to seven-week highs on Fed rate cut bets, safe-haven demand

Gold price rises to seven-week highs to near $4,350 during the early European trading hours on Monday. The precious metal extends its upside amid the prospect of interest rate cuts by the US Fed next year. Lower interest rates could reduce the opportunity cost of holding Gold, supporting the non-yielding precious metal.

Solana consolidates as spot ETF inflows near $1 billion signal institutional dip-buying

Solana price hovers above $131 at the time of writing on Monday, nearing the upper boundary of a falling wedge pattern, awaiting a decisive breakout. On the institutional side, demand for spot Solana Exchange-Traded Funds remained firm, pushing total assets under management to nearly $1 billion since launch. 

Big week ends with big doubts

The S&P 500 continued to push higher yesterday as the US 2-year yield wavered around the 3.50% mark following a Federal Reserve (Fed) rate cut earlier this week that was ultimately perceived as not that hawkish after all. The cut is especially boosting the non-tech pockets of the market.

Solana Price Forecast: SOL consolidates as spot ETF inflows near $1 billion signal institutional dip-buying

Solana (SOL) price hovers above $131 at the time of writing on Monday, nearing the upper boundary of a falling wedge pattern, awaiting a decisive breakout.