S&P 500 breaking 6.000 – Is it a state of euphoria yet?

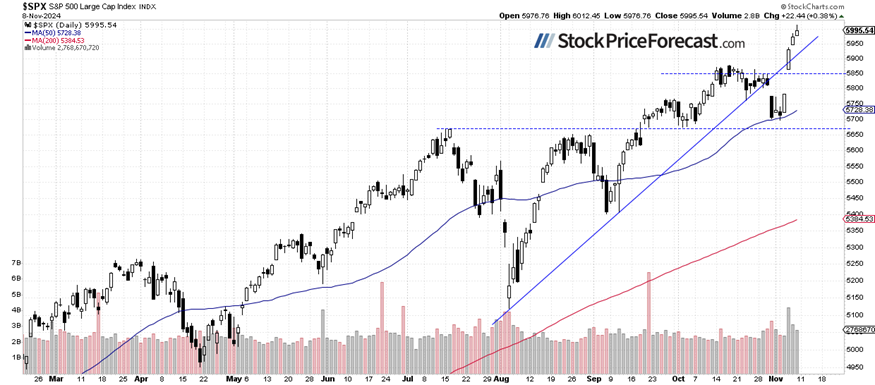
Stocks extended their post-election rally on Friday, with the S&P 500 index setting a new record high of 6,012.45, gaining 0.38%. Although Thursday’s Federal Reserve announcement failed to sustain a rally as the market moved sideways afterward, sentiment improved on Friday. This morning, S&P 500 futures indicate a 0.4% higher open for the index, suggesting the potential for yet another record high.
Last week, the investor sentiment improved once again, as shown in the Wednesday’s AAII Investor Sentiment Survey, which reported that 41.5% of individual investors are bullish, while 27.6% of them are bearish.
The S&P 500 continued its rally after last Tuesday’s election, as we can see on the daily chart.
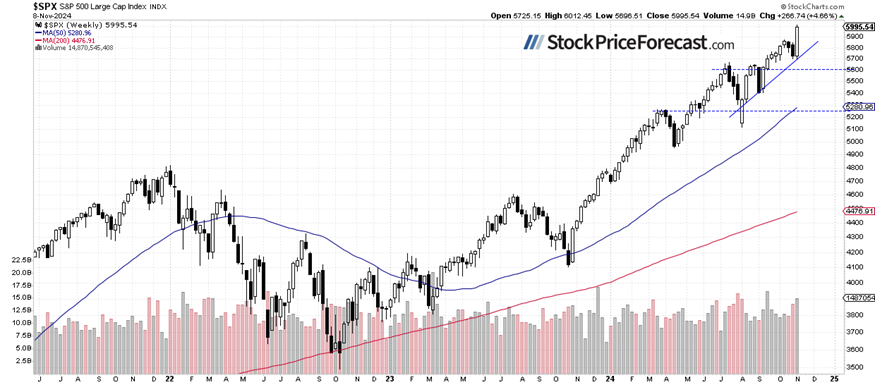
S&P 500: Almost +5% in a week
The S&P 500 surged by 4.66% compared to the prior Friday's close, reaching new record highs and extending its multi-year bull market. The key medium-term support level is now around 5,700, marked by recent lows.
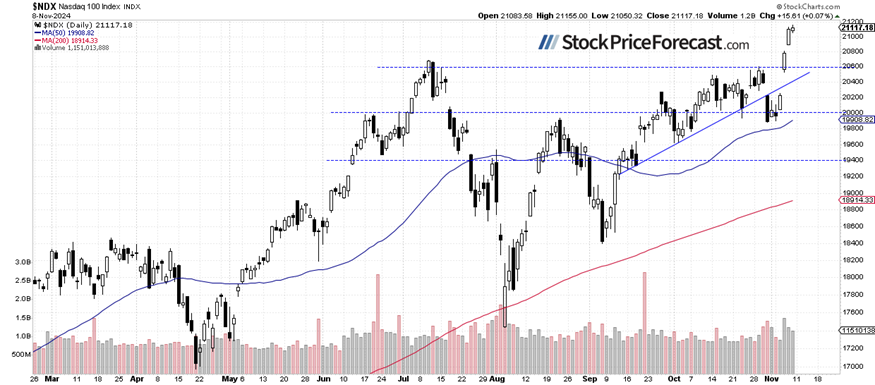
Nasdaq 100: Breaching the 21,000 level
The Nasdaq 100 gained just 0.07% on Friday, achieving a new record high of 21,155. Today, it is expected to open 0.5% higher. The index appears technically overbought in the short term and may be due for a correction or consolidation. The support level is between 20,800 and 20,900, marked by the Thursday’s gap up.
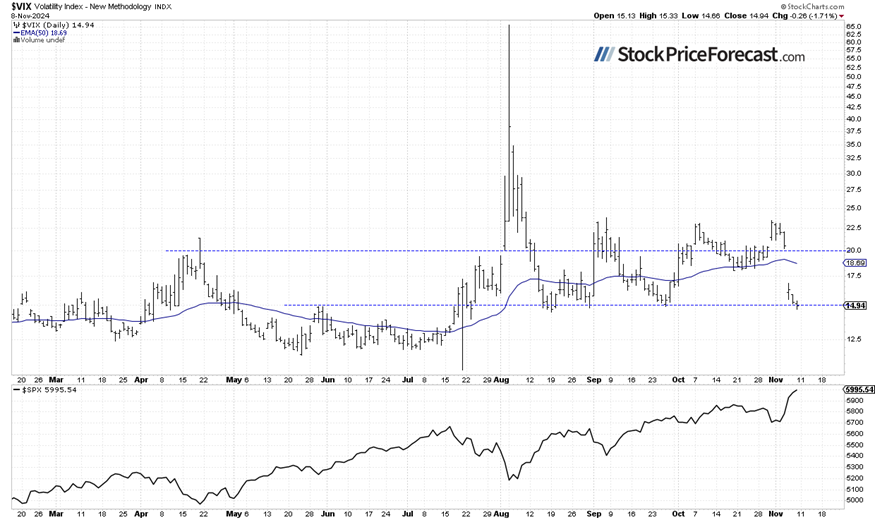
VIX remains near 15
The VIX index, a measure of market volatility, declined by over 20% last Wednesday, moving back below the 20 level and nearing the 15 level. This confirmed risk-on sentiment and a lack of fear in the market.
Historically, a dropping VIX indicates less fear in the market, and rising VIX accompanies stock market downturns. However, the lower the VIX, the higher the probability of the market’s downward reversal. Conversely, the higher the VIX, the higher the probability of the market’s upward reversal.
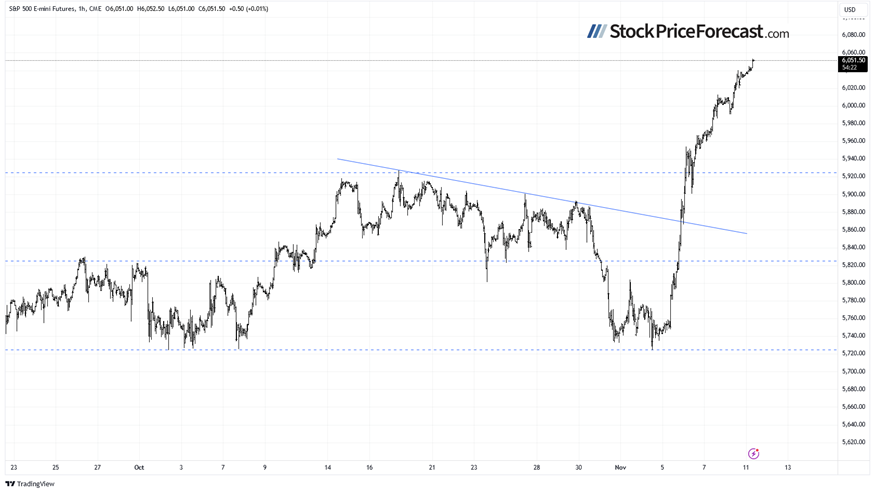
Futures contract advancing beyond 6,000
The S&P 500 futures contract is approaching another new high this morning, moving slightly above the 6,050 level. Support is now at around 5,980-6,000. Although the market appears overbought in the short term, no confirmed negative signals are evident.
Conclusion
Stocks rallied last week, reaching record highs on the back of election results, bolstered by the Fed’s interest rate cut on Thursday. However, this week could see a period of increased volatility or consolidation. Despite this, no negative signals are evident. Investors will be waiting for the important Consumer Price Index release on Wednesday.
In my Stock Price Forecast for November 2024, I wrote “The key question is: Will this sell-off mark the start of a medium-term downtrend, or is it merely a downward correction within an uptrend? For now, it appears to be a correction, but next week’s presidential elections could add to volatility.”
For now, my short-term outlook is neutral.
Here’s the breakdown:
-
The S&P 500 continued its rally last week; another record-breaking advance is anticipated today.
-
A short-term consolidation may be on the horizon.
-
In my opinion, the short-term outlook is neutral.
Want free follow-ups to the above article and details not available to 99%+ investors? Sign up to our free newsletter today!
Want free follow-ups to the above article and details not available to 99%+ investors? Sign up to our free newsletter today!
Author

Paul Rejczak
Sunshine Profits
Paul Rejczak is a stock market strategist who has been known for the quality of his technical and fundamental analysis since the late nineties.


