|

SOXX reacted from our minimum target and it is looking for support

SOXX (iShares Semiconductor ETF) is passively managed to provide concentrated exposure to the 30 largest US-listed semiconductor companies. This includes (i) manufacturers of materials with semiconductors that are used in electronic applications or in LED and OLED technology and (ii) providers of services or equipment associated with semiconductors.

SOXX daily chart December 2021

Soxx

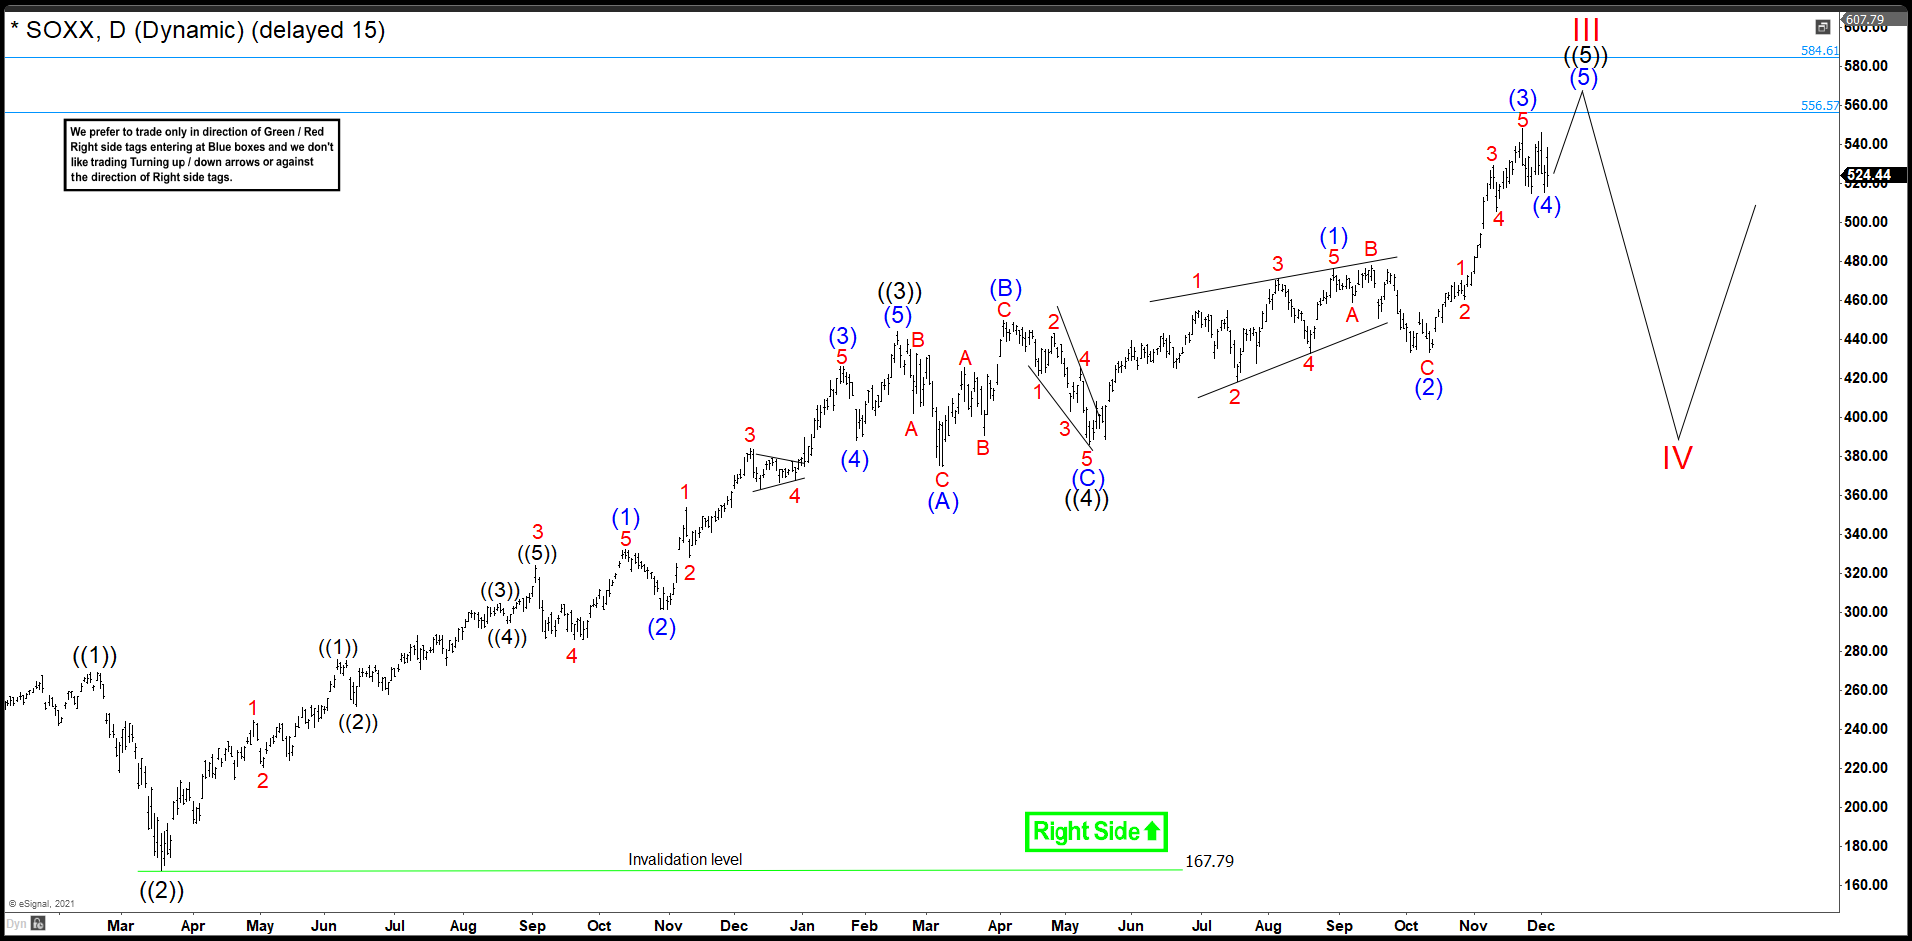
SOXX chart above shows the impulse that we called on December 2021 that began in 2018. You can see 5 waves up and we were looking to complete wave ((5)) in 556.57 – 584.61 area. (If you want to learn more about Elliott Wave Theory, follow these links: Elliott Wave Education and Elliott Wave Theory).

SOXX daily chart March 2022

Soxx

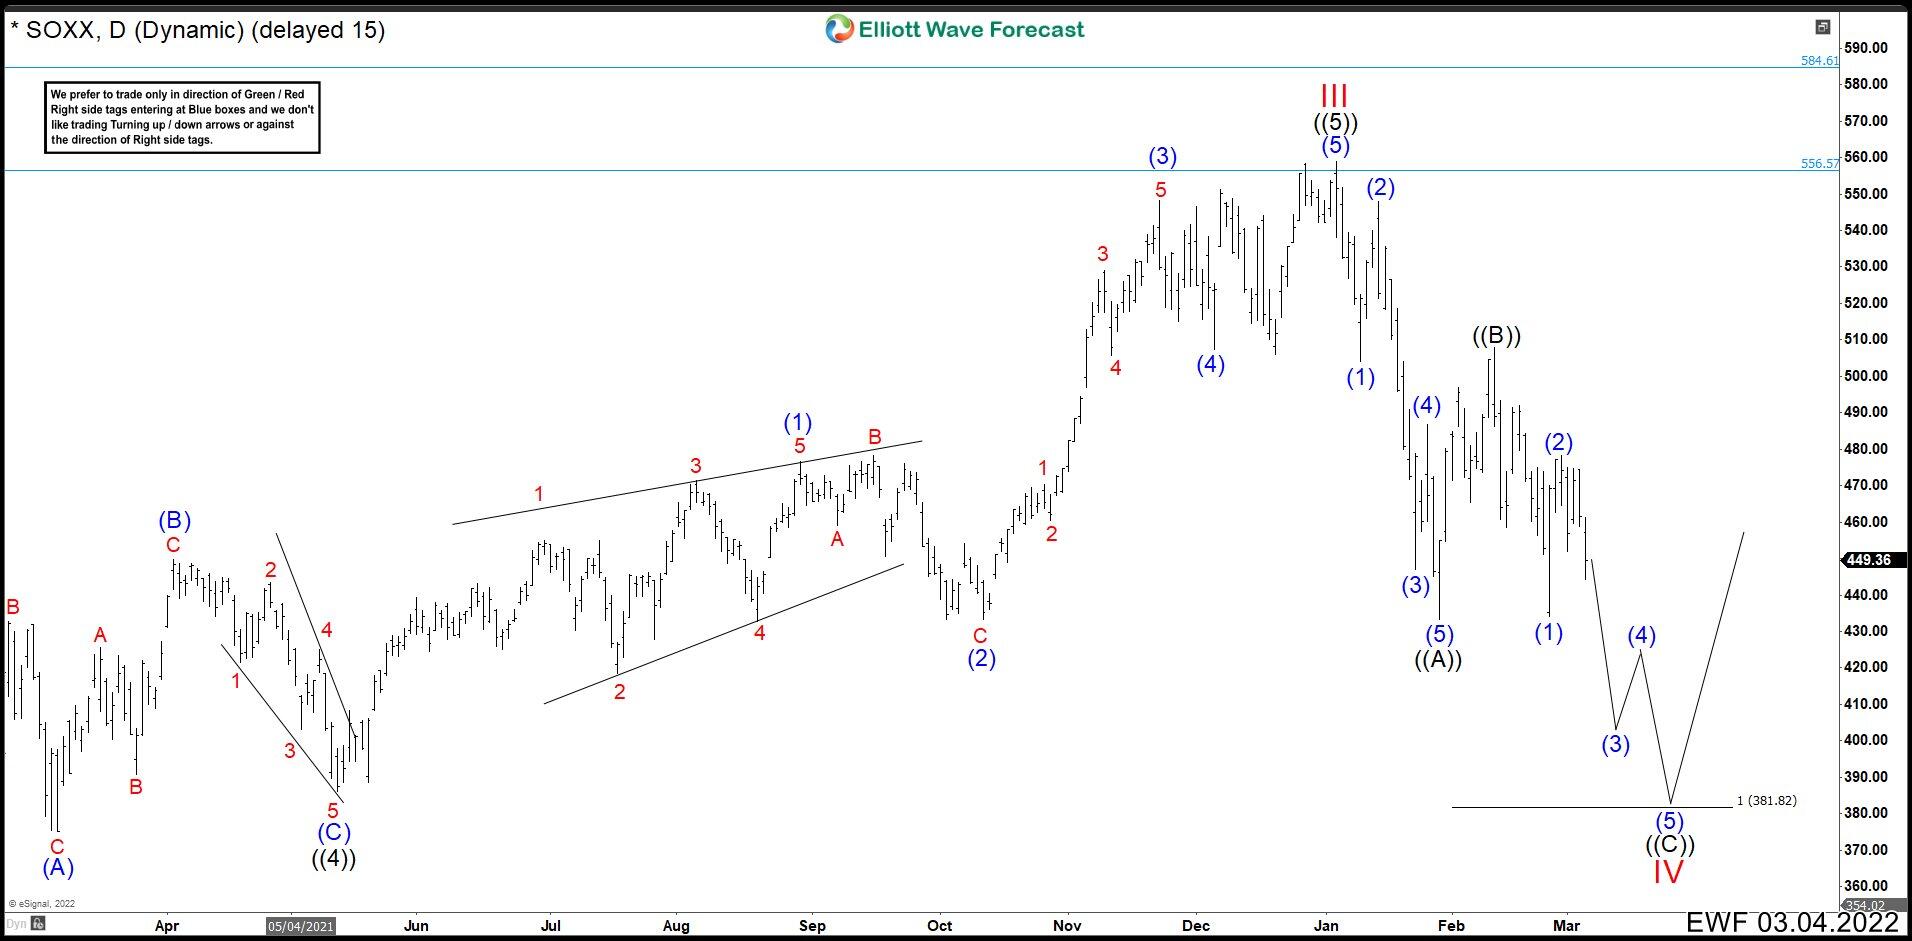
The ETF reached at 559.02 in our target area and reacted down. This completed the wave ((5)) of the impulse from 2018 and also wave III. The drop made 5 waves down bouncing at 433.28 forming a clear impulse structure as we called wave ((A)). Then SOXX rally made a corrective structure in 3 swings ending at 507.88 as wave ((B)). Currently we are developing the last wave ((C)) that could reach a minimum 381.82. This wave should build 5 waves down to structure a correct zig zag Elliott Wave pattern from the peak. Wave (1) and (2) are already done and we need 3 swings more down to complete wave ((C)) of IV and then continue with the rally.

Author

Elliott Wave Forecast Team

Elliott Wave Forecast Team

ElliottWave-Forecast.com

More from Elliott Wave Forecast Team
Share:

Markets move fast. We move first.

Orange Juice Newsletter brings you expert driven insights - not headlines. Every day on your inbox.

By subscribing you agree to our Terms and conditions.

Editor's Picks

EUR/USD drops to daily lows near 1.1630

EUR/USD now loses some traction and slips back to the area of daily lows around 1.1630 on the back of a mild bounce in the US Dollar. Fresh US data, including the September PCE inflation numbers and the latest read on December consumer sentiment, didn’t really move the needle, so the pair is still on course to finish the week with a respectable gain.

GBP/USD trims gains, recedes toward 1.3320

GBP/USD is struggling to keep its daily advance, coming under fresh pressure and retreating to the 1.3320 zone following a mild bullish attempt in the Greenback. Even though US consumer sentiment surprised to the upside, the US Dollar isn’t getting much love, as traders are far more interested in what the Fed will say next week.

Gold makes a U-turn, back to $4,200

Gold is now losing the grip and receding to the key $4,200 region per troy ounce following some signs of life in the Greenback and a marked bounce in US Treasury yields across the board. The positive outlook for the precious metal, however, remains underpinned by steady bets for extra easing by the Fed.

Crypto Today: Bitcoin, Ethereum, XRP pare gains despite increasing hopes of upcoming Fed rate cut

Bitcoin is steadying above $91,000 at the time of writing on Friday. Ethereum remains above $3,100, reflecting positive sentiment ahead of the Federal Reserve's (Fed) monetary policy meeting on December 10.

Week ahead – Rate cut or market shock? The Fed decides

Fed rate cut widely expected; dot plot and overall meeting rhetoric also matter. Risk appetite is supported by Fed rate cut expectations; cryptos show signs of life. RBA, BoC and SNB also meet; chances of surprises are relatively low.

Ripple faces persistent bear risks, shrugging off ETF inflows

Ripple is extending its decline for the second consecutive day, trading at $2.06 at the time of writing on Friday. Sentiment surrounding the cross-border remittance token continues to lag despite steady inflows into XRP spot ETFs.