|

SoFi technologies (SOFI) should continue short-term rally

SoFi Technologies, Inc., (SOFI) provides various financial services in the US, Latin America & Canada. It operates through three segments; Lending, Technology Platform & Financial services. It is based in San Francisco, CA, comes under Financial Services sector & trades as “SOFI” ticker at Nasdaq.

SOFI ended larger weekly correction at $4.24 low in December-2022 & resume higher. It favors upside in ((1)) of III & confirms bullish sequence, when it breaks above July-2023 high.

SOFI – Elliott Wave latest daily view: 

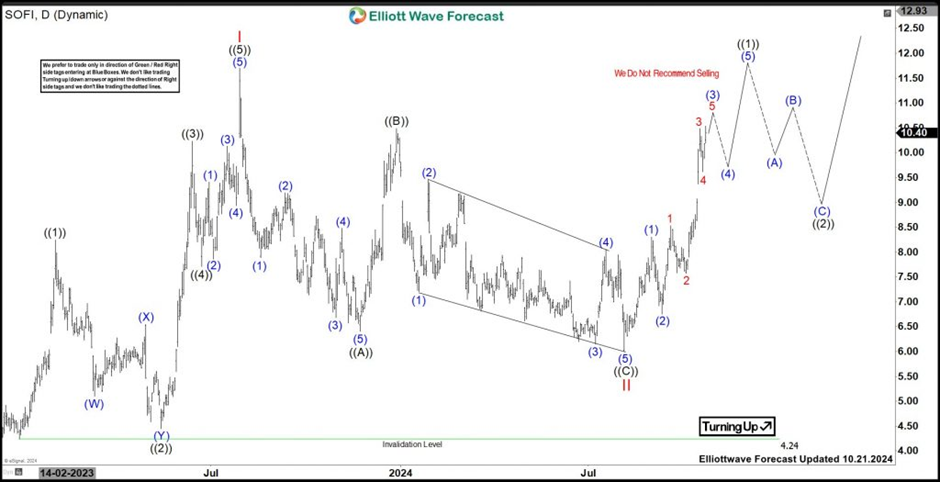
Since inception, it made all time high of $28.26 in February-2021 & all time low at $4.24 in December-2022. Later, it reacted higher as impulse sequence in I, ended at $11.70 high. So, it expects one more push higher against December-2022 low to be 3 swing bounce. It placed ((1)) of I at $8.24 high, ((2)) at 4.45 low, ((3)) at $10.23 high, ((4)) at $7.71 low & ((5)) as I ended at $11.70 high. Below there, it ended II as zigzag correction at $6.01 low. In II, it placed ((A)) at $6.41 low, ((B)) at $10.49 high, ((C)) at $6.01 low in August-2024 low as II.

Above II low, it starts reacting higher in ((1)) of III. It placed (1) at $8.30 high, (2) at $6.75 low & favors upside in (3). Within (3), it placed 1 at $8.53 high, 2 at $7.57 low, 3 at $10.49 high & 4 at $9.62 low. Currently, it favors upside in 5 towards $10.45 – $11.41 area to finish (3) of ((1)) before correcting in (4). Later, it expects another push higher in (5) to finish ((1)) as 9 swings sequence. Further upside in III will confirm above $11.70 high & can extend towards $13.45 – 18.06 area. In that case, we like to buy the next pullback in 3, 7 or 11 swings at extreme areas.

Author

Elliott Wave Forecast Team

Elliott Wave Forecast Team

ElliottWave-Forecast.com

More from Elliott Wave Forecast Team
Share:

Editor's Picks

EUR/USD consolidates around 1.0900, bullish bias remains ahead of key US data

The EUR/USD pair is seen consolidating its strong gains registered over the past two days and oscillating in a narrow band during the Asian session on Tuesday. Spot prices currently trade around the 1.1900 mark, just below an over one-week high touched the previous day.

GBP/USD tilts bullish as markets barrel toward mid-week NFP print

GBP/USD is holding a broader bullish structure on the daily chart, with price trading well above the 50 Exponential Moving Average at 1.3507 and the 200 EMA at 1.3310, confirming the intermediate uptrend that has been in place since the November 2025 low near 1.2300. 

Gold: Will US Retail Sales data propel it above $5,100?

Gold hovers below weekly highs of $5,087 early Tuesday, await US Retail Sales data. The US Dollar enters a downside consolidation phase amid persistent Japanese Yen strength and worsening labor market. Gold settled Monday above $5,000, now looks to take out $5,100 amid bullish daily RSI.

Top Crypto Gainers: World Liberty Financial, MemeCore and Quant gain momentum

World Liberty Financial, MemeCore, and Quant are leading gains over the last 24 hours as the broader cryptocurrency market stabilizes after last week’s correction. Still, the technical outlook for altcoins remains mixed due to prevailing downside pressure and vulnerable market sentiment. 

Follow the money, what USD/JPY in Tokyo is really telling you

Over the past two Tokyo sessions, this has not been a rate story. Not even close. Interest rate differentials have been spectators, not drivers. What has moved USD/JPY in local hours has been flow and flow alone.

Ripple exposed to volatility amid low retail interest, modest fund inflows

Ripple (XRP) is extending its intraday decline to around $1.40 at the time of writing on Monday amid growing pressure from the retail market and risk-off sentiment that continues to keep investors on the sidelines.