|

SoFi Technologies (SOFI) favors rally into $26.21 – $28.01 area before pullback

SoFi Technologies, Inc., (SOFI) provides various financial services in the US, Latin America, Canada & Hong Kong. It operates through three segments; Lending, Technology Platform & Financial services. It comes under Financial Services sector & trades as “SOFI” ticker at Nasdaq.

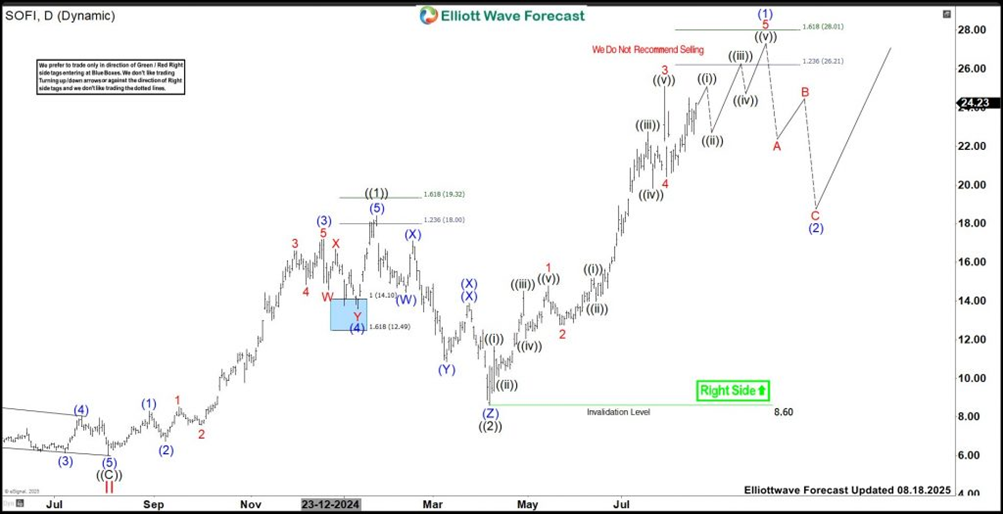
SOFI favors rally in 5 of (1) from April-2025 low as explained in previous article, which confirms above $25.11 high. It should rally targeting into $26.21 – $28.01 area against 7.30.2025 low before correcting next. We like to buy the next pullback in (2) in 3, 7 or 11 swings later against April low.

SOFI – Elliott Wave latest daily view

Chart

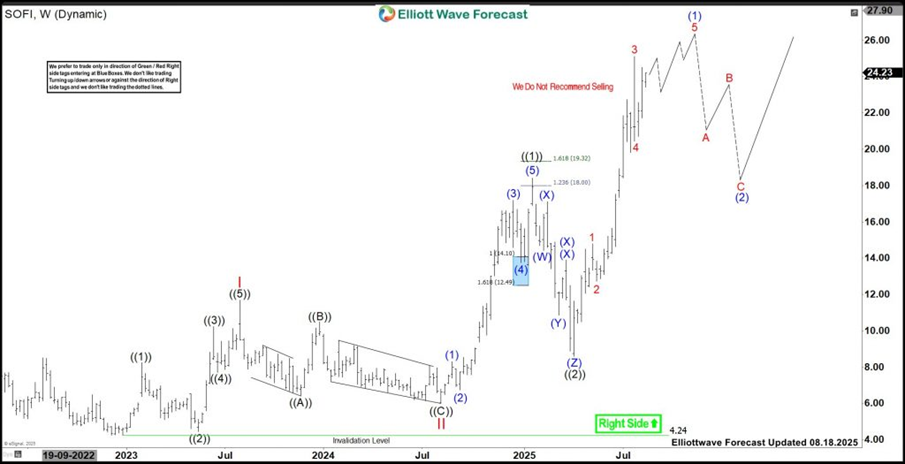
It made all time low of $4.24 in December-2022. Above there, it favors rally in (1) of ((3)) of III from 4.07.2025 low in proposed nesting. It placed I at $11.70 high in diagonal sequence in July-2023 & II as zigzag correction at $6.01 low in August-2024. It was corrected 0.764 in Fibonacci retracement in II before rally in ((1)) of III. It ended ((1)) at $18.42 high in January-2025 & ((2)) at $8.60 low in April-2025. Within ((1)), it placed (1) at $8.30 high, (2) at $6.75 low, (3) at $17.19 high as extended wave, (4) at $13.60 low & finally (5) at $18.42 high as ((1)). Wave ((2)) was corrected in 11 swings.

SOFI – Elliott Wave view from 7.21.2025

Chart

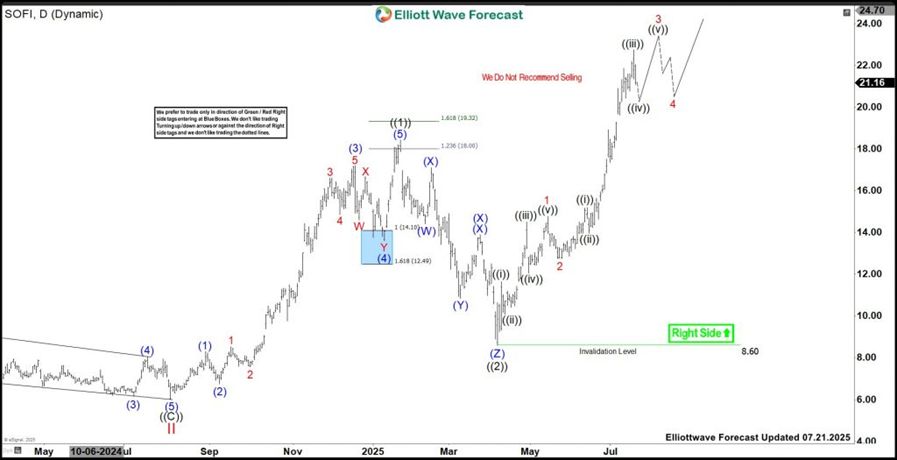
Above ((2)) low, it already confirmed higher high sequence indicates the bullish bias against April-2025 low. It favors rally in (1) of ((3)) & expect one push higher above 7.30.2025 low. Within (1), it placed 1 at $14.78 high, 2 at $12.74 low, 3 at $25.11 high, 4 at $20.43 low & favors rally in 5 of (1). Currently, it favors upside in ((i)) of 5 & expect a break above $24.50 high to finish it before correcting in ((ii)). As long as it holds above $20.43 low, it should rally into $26.21 – $28.01 area to finish (1) either as impulse or diagonal sequence. We like to buy the next pullback in 3, 7 or 11 swings in (2) against April-2025 low. If it breaks above $28.01 high & erase the momentum divergence, then it can see even more upside. So, we don’t recommend selling it in any pullback.

SOFI – Elliott Wave latest weekly view

Chart

Author

Elliott Wave Forecast Team

Elliott Wave Forecast Team

ElliottWave-Forecast.com

More from Elliott Wave Forecast Team
Share:

Markets move fast. We move first.

Orange Juice Newsletter brings you expert driven insights - not headlines. Every day on your inbox.

By subscribing you agree to our Terms and conditions.

Editor's Picks

EUR/USD moves sideways below 1.1800 on Christmas Eve

EUR/USD struggles to find direction and trades in a narrow channel below 1.1800 after posting gains for two consecutive days. Bond and stock markets in the US will open at the usual time and close early on Christmas Eve, allowing the trading action to remain subdued. 

GBP/USD keeps range around 1.3500 amid quiet markets

GBP/USD keeps its range trade intact at around 1.3500 on Wednesday. The Pound Sterling holds the upper hand over the US Dollar amid pre-Christmas light trading as traders move to the sidelines heading into the holiday season. 

Gold retreats from record highs, trades below $4,500

Gold retreats after setting a new record-high above $4,520 earlier in the day and trades in a tight range below $4,500 as trading volumes thin out ahead of the Christmas break. The US Dollar selling bias remains unabated on the back of dovish Fed expectations, which continues to act as a tailwind for the bullion amid persistent geopolitical risks.

Bitcoin slips below $87,000 as ETF outflows intensify, whale participation declines

Bitcoin price continues to trade around $86,770 on Wednesday, after failing to break above the $90,000 resistance. US-listed spot ETFs record an outflow of $188.64 million on Tuesday, marking the fourth consecutive day of withdrawals.

Economic outlook 2026-2027 in advanced countries: Solidity test

After a year marked by global economic resilience and ending on a note of optimism, 2026 looks promising and could be a year of solid economic performance. In our baseline scenario, we expect most of the supportive factors at work in 2025 to continue to play a role in 2026.

Avalanche struggles near $12 as Grayscale files updated form for ETF

Avalanche trades close to $12 by press time on Wednesday, extending the nearly 2% drop from the previous day. Grayscale filed an updated form to convert its Avalanche-focused Trust into an ETF with the US Securities and Exchange Commission.