Small-caps: Hidden gems or risky bet?

Key points
- Small-caps are back in focus as hopes of Fed rate cuts fuel momentum. Lower borrowing costs tend to help smaller, more domestically focused companies that are sensitive to financing conditions.
- With recession concerns more contained, small-caps often perform better as credit conditions ease, and investors look beyond mega-cap leaders.
- Valuations also look more attractive relative to large caps. While many firms still struggle with profitability, focusing on stronger, profitable names highlights why small-caps can offer both opportunity and risk.
Why small-caps are back on the radar
Smaller companies in the US (called “small-caps”) have started to shine again. Investors believe the US central bank (the Fed) will start cutting interest rates soon. Lower rates usually help smaller, more local businesses because they borrow more and are sensitive to financing costs.
Recession concerns also look contained for now, which historically supports small-caps because they tend to do better when economic conditions remain supported.
Small-caps also look cheaper than big companies like Apple or Microsoft. If the economy stabilizes and borrowing costs fall, small companies could see a bigger rebound than the giants that already had their rally.
What is the Russell 2000?
When people talk about “small-caps” in the US, they often mean the Russell 2000 index. This index tracks 2,000 of the smaller companies listed in the US stock market. Unlike the S&P 500, which covers the biggest and most established firms, the Russell 2000 gives a picture of how Main Street businesses are doing.
Because these companies are smaller, they tend to:
- Be more sensitive to interest rates (they borrow more relative to their size).
- Have more domestic exposure (less global diversification).
- Offer higher growth potential, but also higher risk.
Investors often use the Russell 2000 as a barometer of the US economy beyond the big tech names and household brands.
Not all small-caps are equal
While the Russell 2000 is the most widely known small-cap index, it has a problem: many of its companies are not profitable. Almost half lose money. That makes it risky to buy the entire index blindly.
A useful alternative is the S&P SmallCap 600, another index of smaller US companies. The key difference: it only includes businesses that are already profitable. This simple filter makes it a better-quality small-cap benchmark.
So, in comparison:
- Russell 2000: Includes about 2,000 small US companies. It does not require profitability, so nearly half of its members are loss-making. This makes it a very broad but riskier view of small-caps.
- S&P 600: Includes around 600 smaller US companies, but with a profitability filter. Companies must be making money to be included. This has historically led to stronger returns with lower volatility.
Bottom line: The S&P 600 focuses on the stronger small-caps, while the Russell 2000 covers all small-caps—good and bad.
How have small-caps performed and how are they valued?
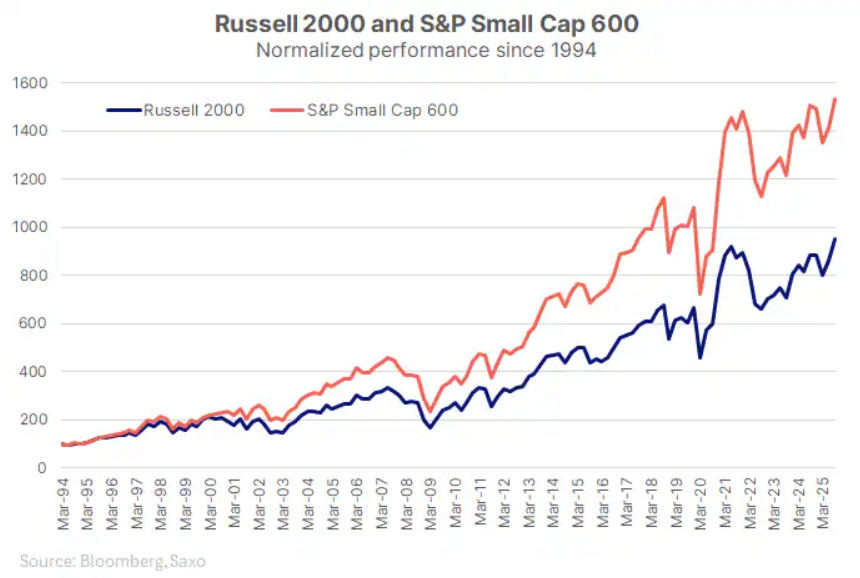
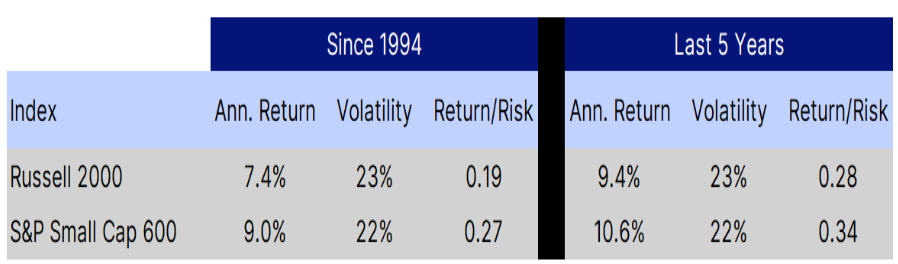
Here are the key metrics comparing Russell 2000 (RTY) and S&P 600 (SML) since 1994 (when S&P 600 was launched) and over the last 5 years:
- Over the long run (since 1994), the S&P 600 has delivered higher returns, slightly lower volatility, and stronger risk-adjusted returns than the Russell 2000. This highlights the advantage of its profitability filter.
- Over the last 5 years, both indexes performed better, supported by recovery and rate-cycle dynamics, but the S&P 600 again edged ahead with higher returns and better efficiency.
- Overall, history shows that quality matters: the S&P 600 consistently offers more reward per unit of risk than the broader Russell 2000.
Valuation analysis
- Price-to-earnings (P/E): The Russell 2000 trades on a forward P/E of about 25.9, reflecting the drag of many loss-making companies. The S&P 600, by contrast, is at a much lower 16.2, showing how its profitability filter keeps valuations more grounded.
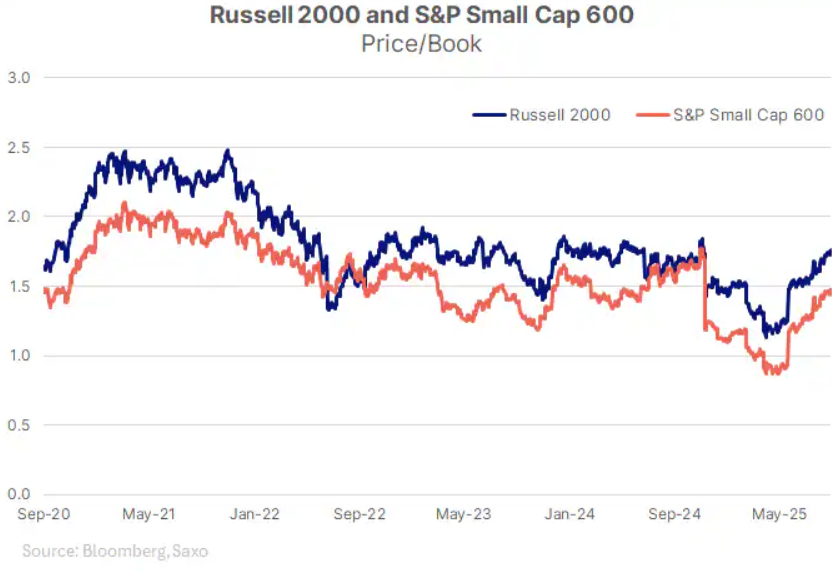
- Price-to-book (P/B): On a 1-year forward basis, the Russell 2000 sits around 1.75 versus 1.48 for the S&P 600. Both are cheaper than large caps, but again the S&P 600 looks more reasonable when quality is factored in.
- Relative to the S&P 500: Small-caps trade at a notable discount, but quality screens like the S&P 600 narrow the gap while still looking attractive.
These patterns highlight a key point: small-caps usually do better when interest rates are falling, credit conditions are easier, and the economic momentum is supported. They tend to lag when borrowing costs are high or when investors crowd into mega-cap tech.
Scenario playbook
Base case
- Macro backdrop: The Fed cuts rates once in September, but signals patience as inflation eases slowly.
- Impact on small-caps: Small-caps benefit, but only the stronger ones keep up momentum. Relief rally could fade without multiple cuts.
- Positioning: Focus on profitable small-caps with solid balance sheets. Indices like the S&P 600 or small-cap quality/value screens, which tend to feature companies with steadier cash flow and more manageable debt profiles, while broad Russell 2000 beta remains riskier due to its larger share of loss-making firms.
Hawkish case
- Macro backdrop: Sticky inflation, tariffs, or commodity shocks keep Fed cautious.
- Impact on small-caps: small-caps may struggle again because higher borrowing costs hit them hardest.
- Positioning: Exposure could remain light, with defensive large caps offering relative resilience until the outlook becomes clearer.
Dovish case
- Macro backdrop: Fed front-loads cuts or growth data worsens; yields fall quickly.
- Impact on small-caps: Strong rally given cheaper valuations and rate sensitivity which drive outperformance.
- Positioning: This is when a broader small-cap index like the Russell 2000 could see outsized gains, but with higher volatility.
Risks to watch
While the setup looks more constructive for small-caps, there are risks that could challenge the outlook:
- Fed under-delivers: If the pace of rate cuts is slower than markets expect, small-cap momentum could fade quickly.
- Credit stress: Smaller companies are more vulnerable to refinancing needs and higher borrowing costs, which could pressure profitability.
- Policy uncertainty: Trade tariffs or sticky inflation could keep pressure on margins and delay the recovery cycle.
- Market concentration: If investors continue to crowd into large-cap tech, small-caps may struggle to attract sustained flows.
Conclusion
Small-caps are interesting, but not indiscriminately. The Fed’s next move will define the path: a measured cut cycle favors quality small-caps, while broad beta only pays off if easing accelerates.
The lesson for investors from history is clear: small-caps can work, but selectivity – profitability, valuation discipline, and balance-sheet strength – matters more than simply buying the whole basket.
Read the original analysis: Small-caps: Hidden gems or risky bet?
Author
Saxo Research Team
Saxo Bank
Saxo is an award-winning investment firm trusted by 1,200,000+ clients worldwide. Saxo provides the leading online trading platform connecting investors and traders to global financial markets.


