Silver rallies toward $78 as markets cheer possible US-Iran truce
- Silver (XAG/USD) gathers bullish momentum, rises more than 6% on the day.
- The US Dollar (USD) stays under heavy selling pressure midweek.
- Markets grow optimistic about an end to the US-Iran conflict.

Silver (XAG/USD) price rallies midweek and gains more than 6% on the day, trading near $77.50.
The broad-based selling pressure surrounding the US Dollar (USD) fuels XAG/USD's upsurge as investors cheer news claiming that the United States (US) and Iran are nearing a truce deal.
Axios reported earlier in the session that the deal would have both sides lifting restrictions in the Strait of Hormuz. Additionally, Iran is expected to commit to a moratorium on nuclear enrichment, while the US is seen lifting sanctions and releasing billions in frozen Iranian funds.
Citing a Pakistani source involved in negotiations, Reuters confirmed that sides are very close to finalizing a deal.
Reflecting the improving risk mood, US stock index futures were last seen rising between 1.2% and 1.7% on the day. In the meantime, the USD Index, which tracks the USD's performance against a basket of six major currencies, loses about 0.8% on the day near 97.70.
Silver Technical Analysis
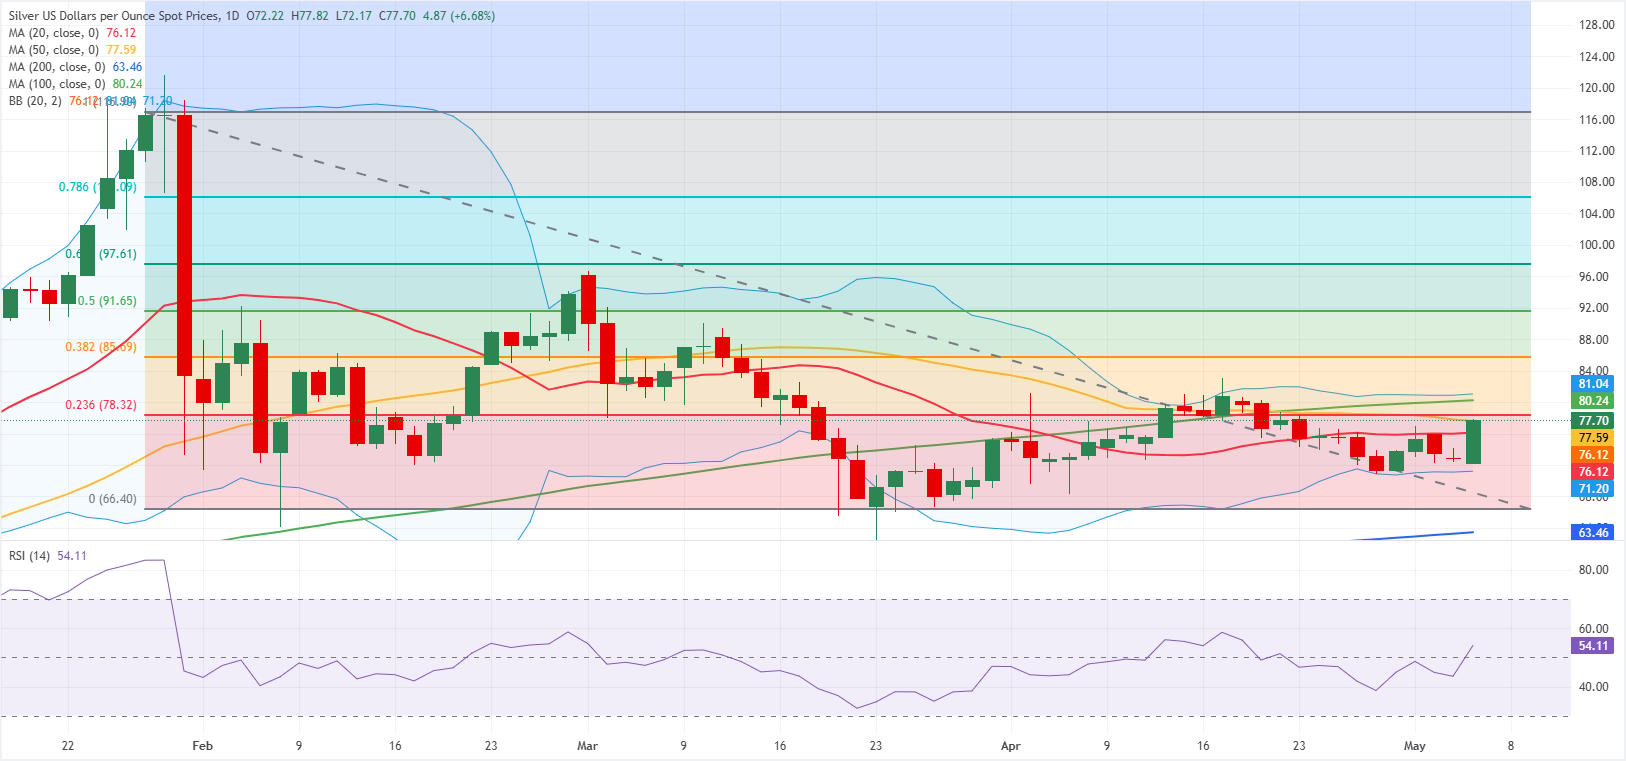
In the daily chart, XAG/USD trades at $77.68. The Bollinger middle band at roughly $76 reinforces this underlying demand zone, while a mildly positive Relative Strength Index (RSI) near 54 suggests balanced but slightly constructive momentum rather than a clear directional breakout.
On the topside, the first resistance is the 23.6% Fibonacci retracement of the $66.40–$116.90 rally at $78.32, followed by the 100-day SMA at $80.24 and the upper Bollinger band near $81.04. A daily close above this band would open the way toward the 38.2% retracement at $85.69.
On the downside, initial support is seen at the 50-day SMA at $77.59, with additional protection at the 20-day SMA and Bollinger mid-line around $76.12; a break there would expose the lower Bollinger band near $71.20 before the broader corrective floor at the $66.40 Fibonacci swing low, where the 200-day SMA at $63.46 underpins the longer-term uptrend.
(The technical analysis of this story was written with the help of an AI tool.)
Silver FAQs
Silver is a precious metal highly traded among investors. It has been historically used as a store of value and a medium of exchange. Although less popular than Gold, traders may turn to Silver to diversify their investment portfolio, for its intrinsic value or as a potential hedge during high-inflation periods. Investors can buy physical Silver, in coins or in bars, or trade it through vehicles such as Exchange Traded Funds, which track its price on international markets.
Silver prices can move due to a wide range of factors. Geopolitical instability or fears of a deep recession can make Silver price escalate due to its safe-haven status, although to a lesser extent than Gold's. As a yieldless asset, Silver tends to rise with lower interest rates. Its moves also depend on how the US Dollar (USD) behaves as the asset is priced in dollars (XAG/USD). A strong Dollar tends to keep the price of Silver at bay, whereas a weaker Dollar is likely to propel prices up. Other factors such as investment demand, mining supply – Silver is much more abundant than Gold – and recycling rates can also affect prices.
Silver is widely used in industry, particularly in sectors such as electronics or solar energy, as it has one of the highest electric conductivity of all metals – more than Copper and Gold. A surge in demand can increase prices, while a decline tends to lower them. Dynamics in the US, Chinese and Indian economies can also contribute to price swings: for the US and particularly China, their big industrial sectors use Silver in various processes; in India, consumers’ demand for the precious metal for jewellery also plays a key role in setting prices.
Silver prices tend to follow Gold's moves. When Gold prices rise, Silver typically follows suit, as their status as safe-haven assets is similar. The Gold/Silver ratio, which shows the number of ounces of Silver needed to equal the value of one ounce of Gold, may help to determine the relative valuation between both metals. Some investors may consider a high ratio as an indicator that Silver is undervalued, or Gold is overvalued. On the contrary, a low ratio might suggest that Gold is undervalued relative to Silver.
Author

Eren Sengezer
FXStreet
As an economist at heart, Eren Sengezer specializes in the assessment of the short-term and long-term impacts of macroeconomic data, central bank policies and political developments on financial assets.


