Why is Crude Oil priced for a reopening the ships haven't made?

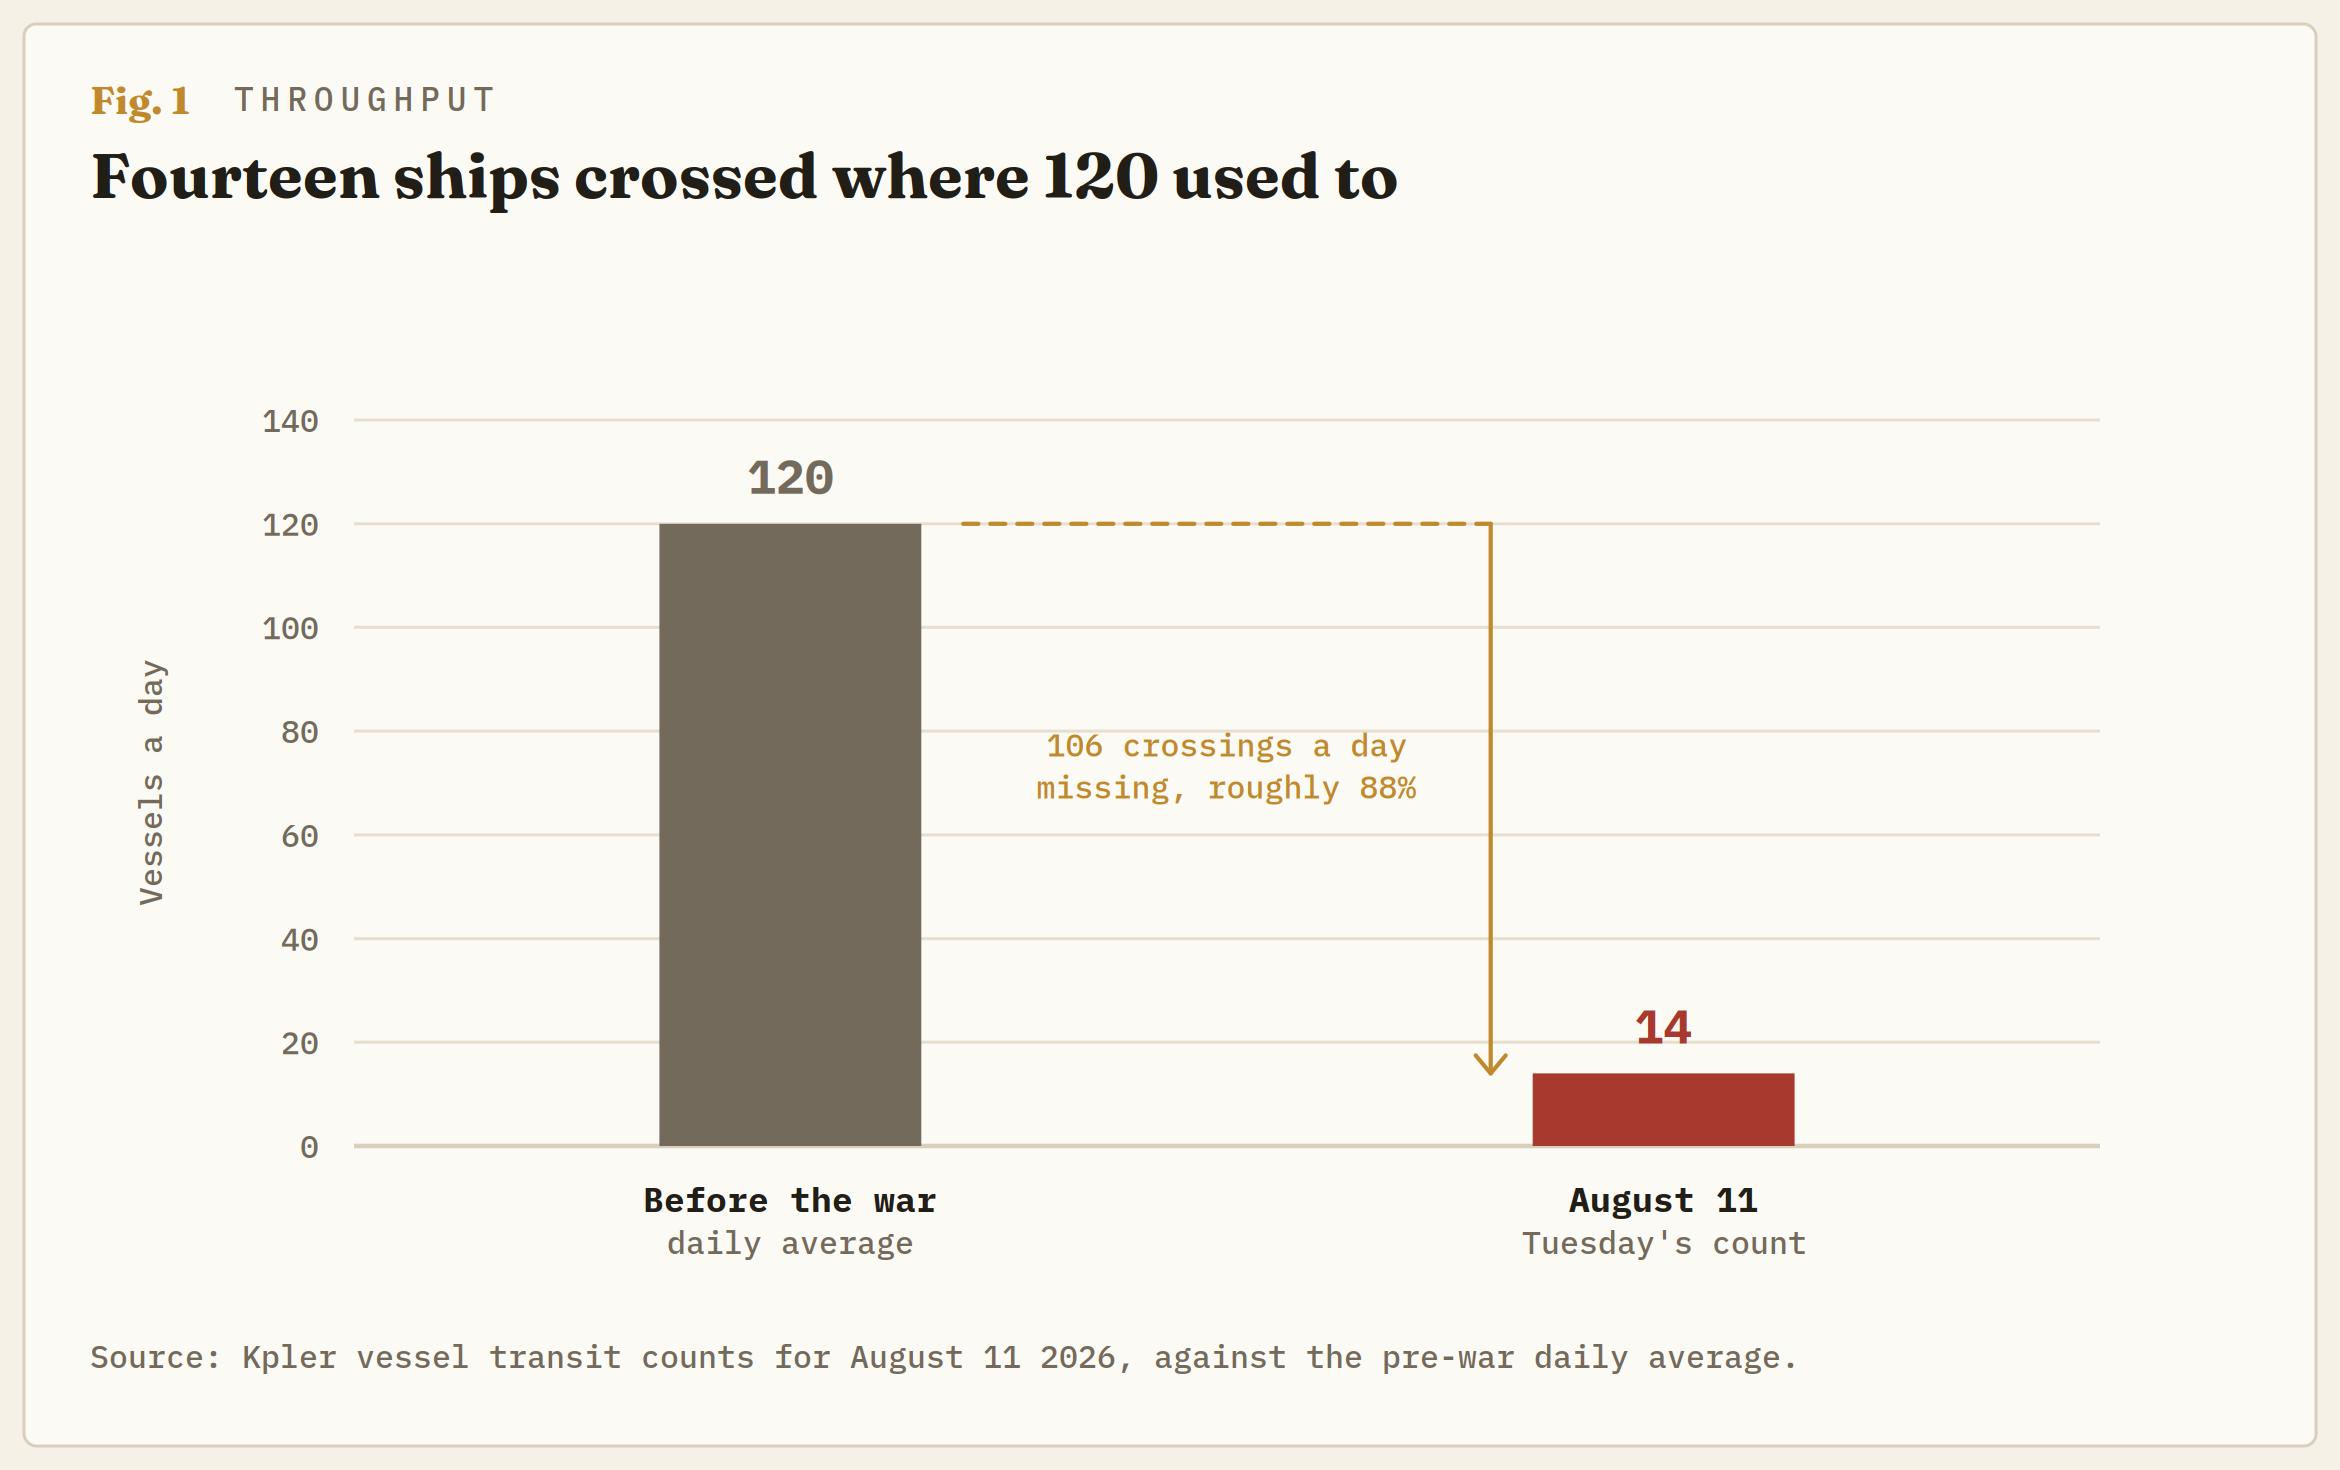
Fourteen vessels crossed the Strait of Hormuz on Tuesday. Before the war, the count ran near 120 a day. In the sessions since the waterway was publicly declared open, Brent has drifted back to $87 and West Texas Intermediate (WTI) to $81, both a little lower again on Wednesday, with daily momentum on each unwound from the top of its range in late July to the low twenties now.
The announcement has been priced. The barrels have not moved. That gap is the trade, and it is unusually wide.
The waterway is running at about one ship in nine
Cargo-tracking data puts Tuesday's transit count at 14. Against a pre-war baseline near 120 a day, that is roughly 12% of normal throughput, and the firm collecting the numbers has been explicit that the modest pickup from the worst of the shutdown does not amount to normalisation.
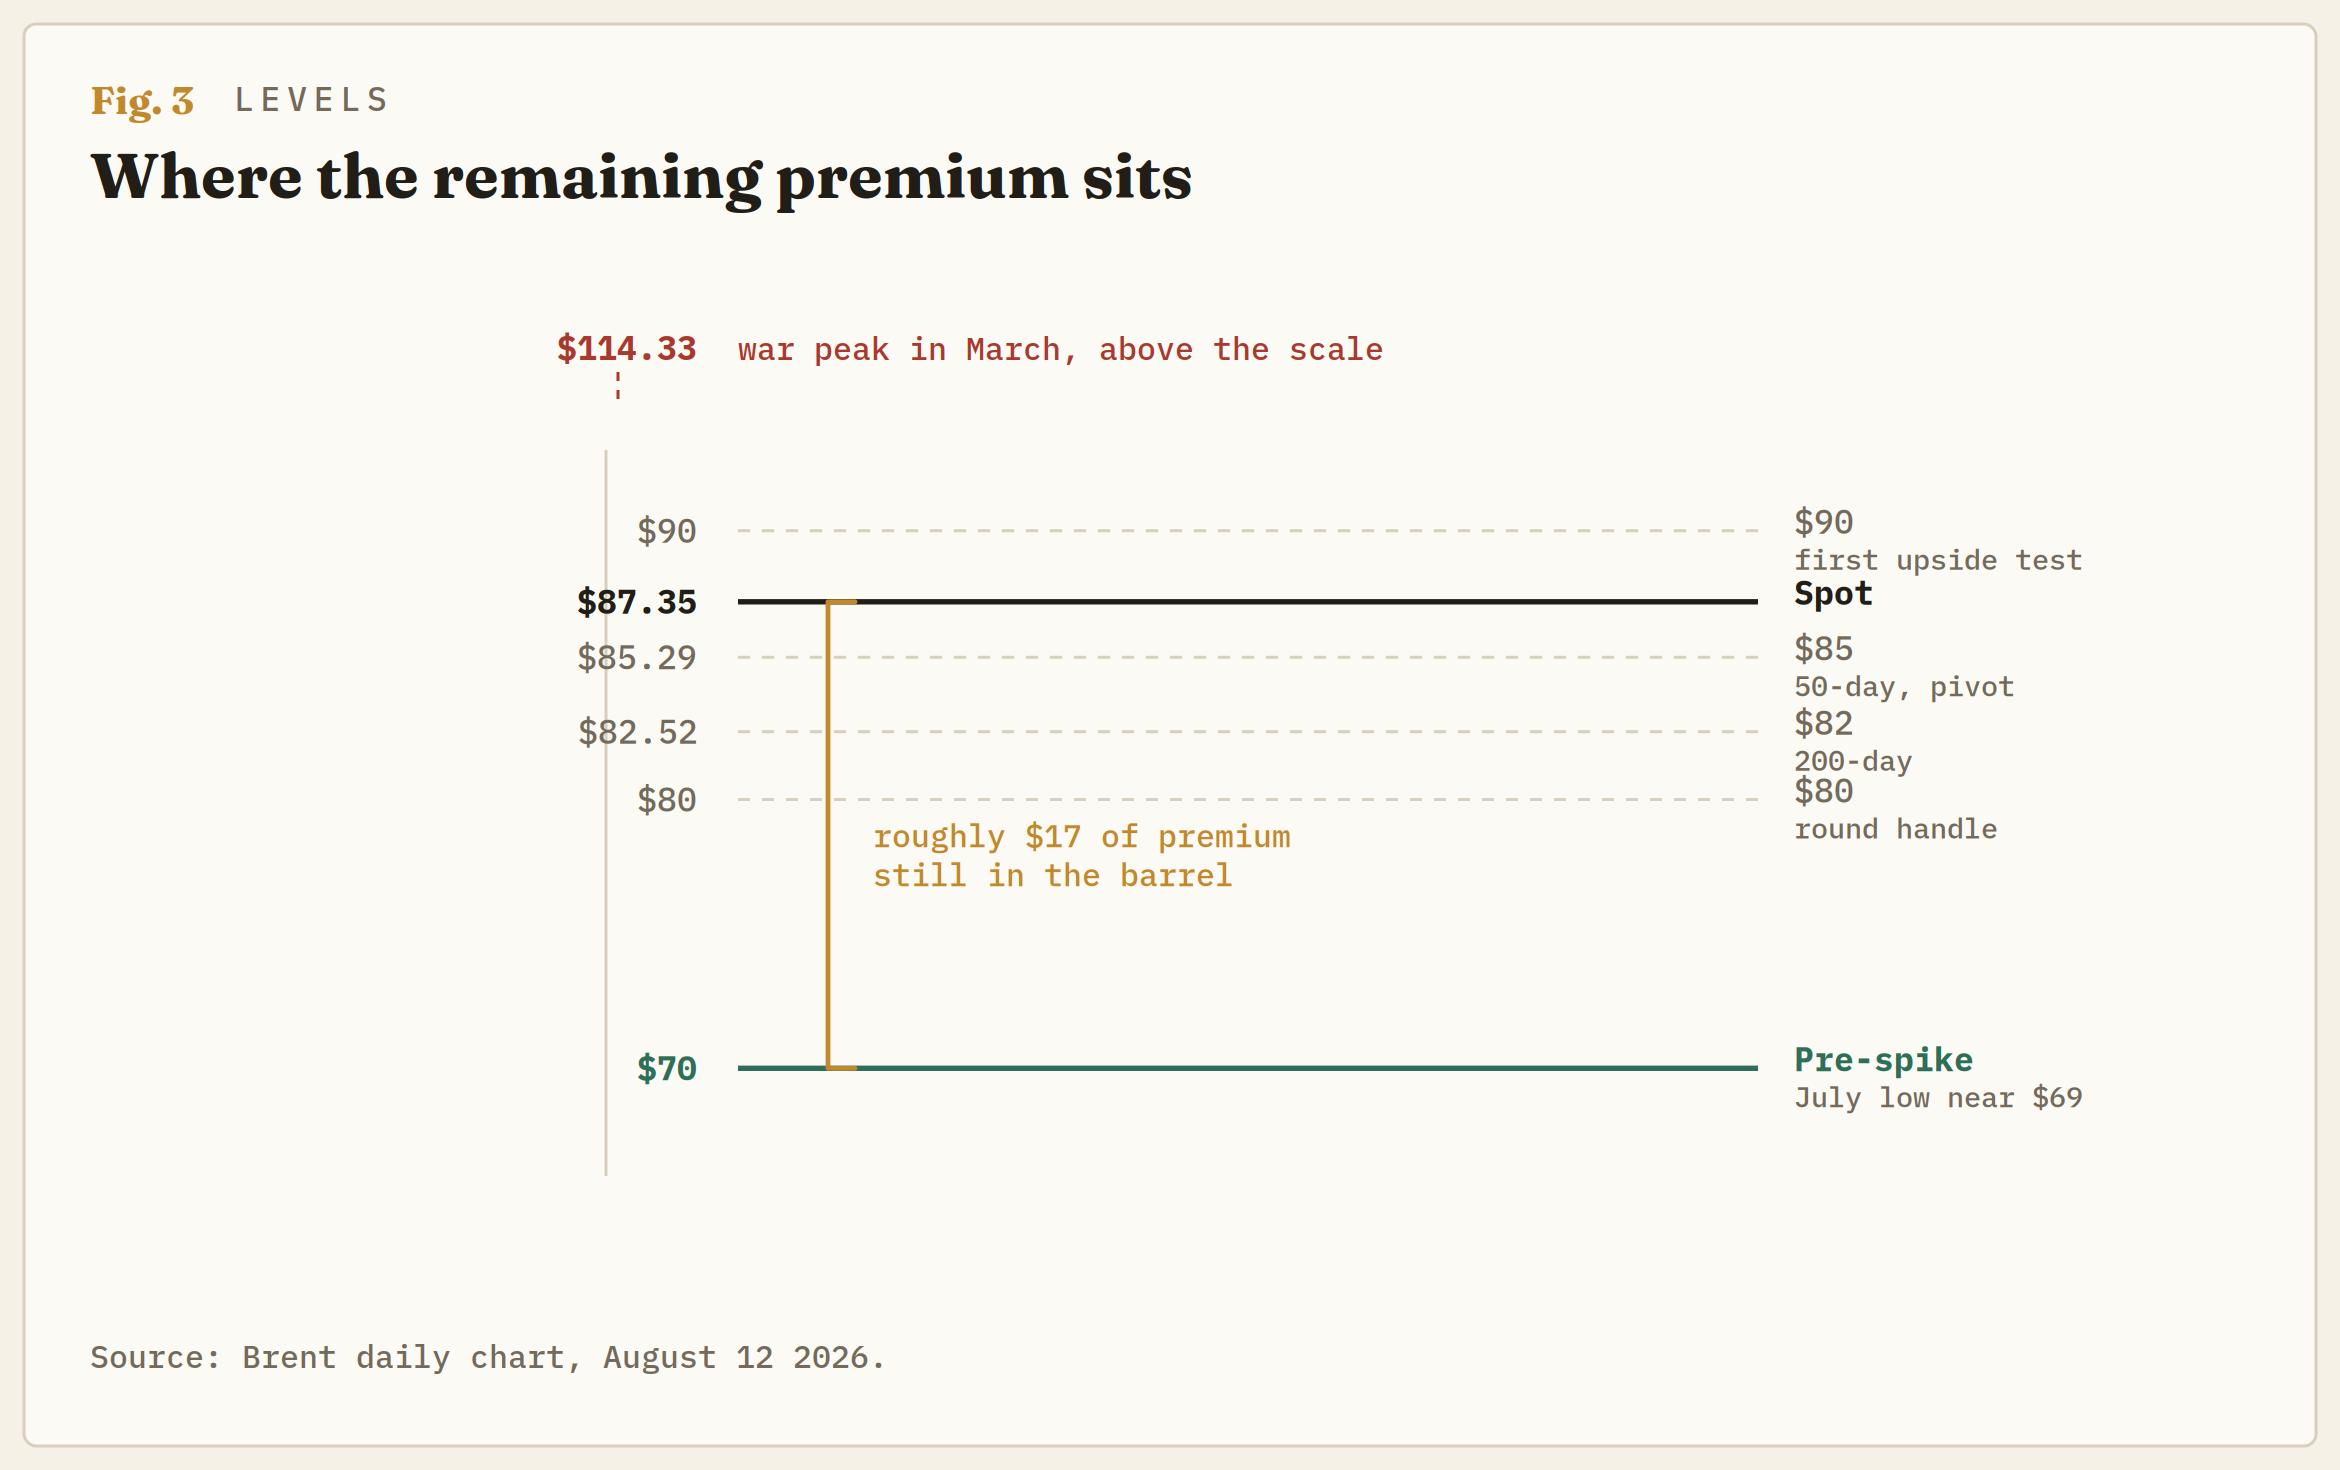
Hold that against the price. Brent sits about $17 above the $70 area it occupied before the March spike, and revisited as recently as the July low near $69. That is a premium of roughly 25% still embedded in the seaborne benchmark. WTI carries a smaller version of the same thing.
So the market is pricing partial normalisation of a chokepoint that is delivering an eighth of its usual traffic. One of those two numbers is wrong, and the physical count is the one that is directly observ
A route is not a reopening
The detail that matters most is not the total. It is the composition.
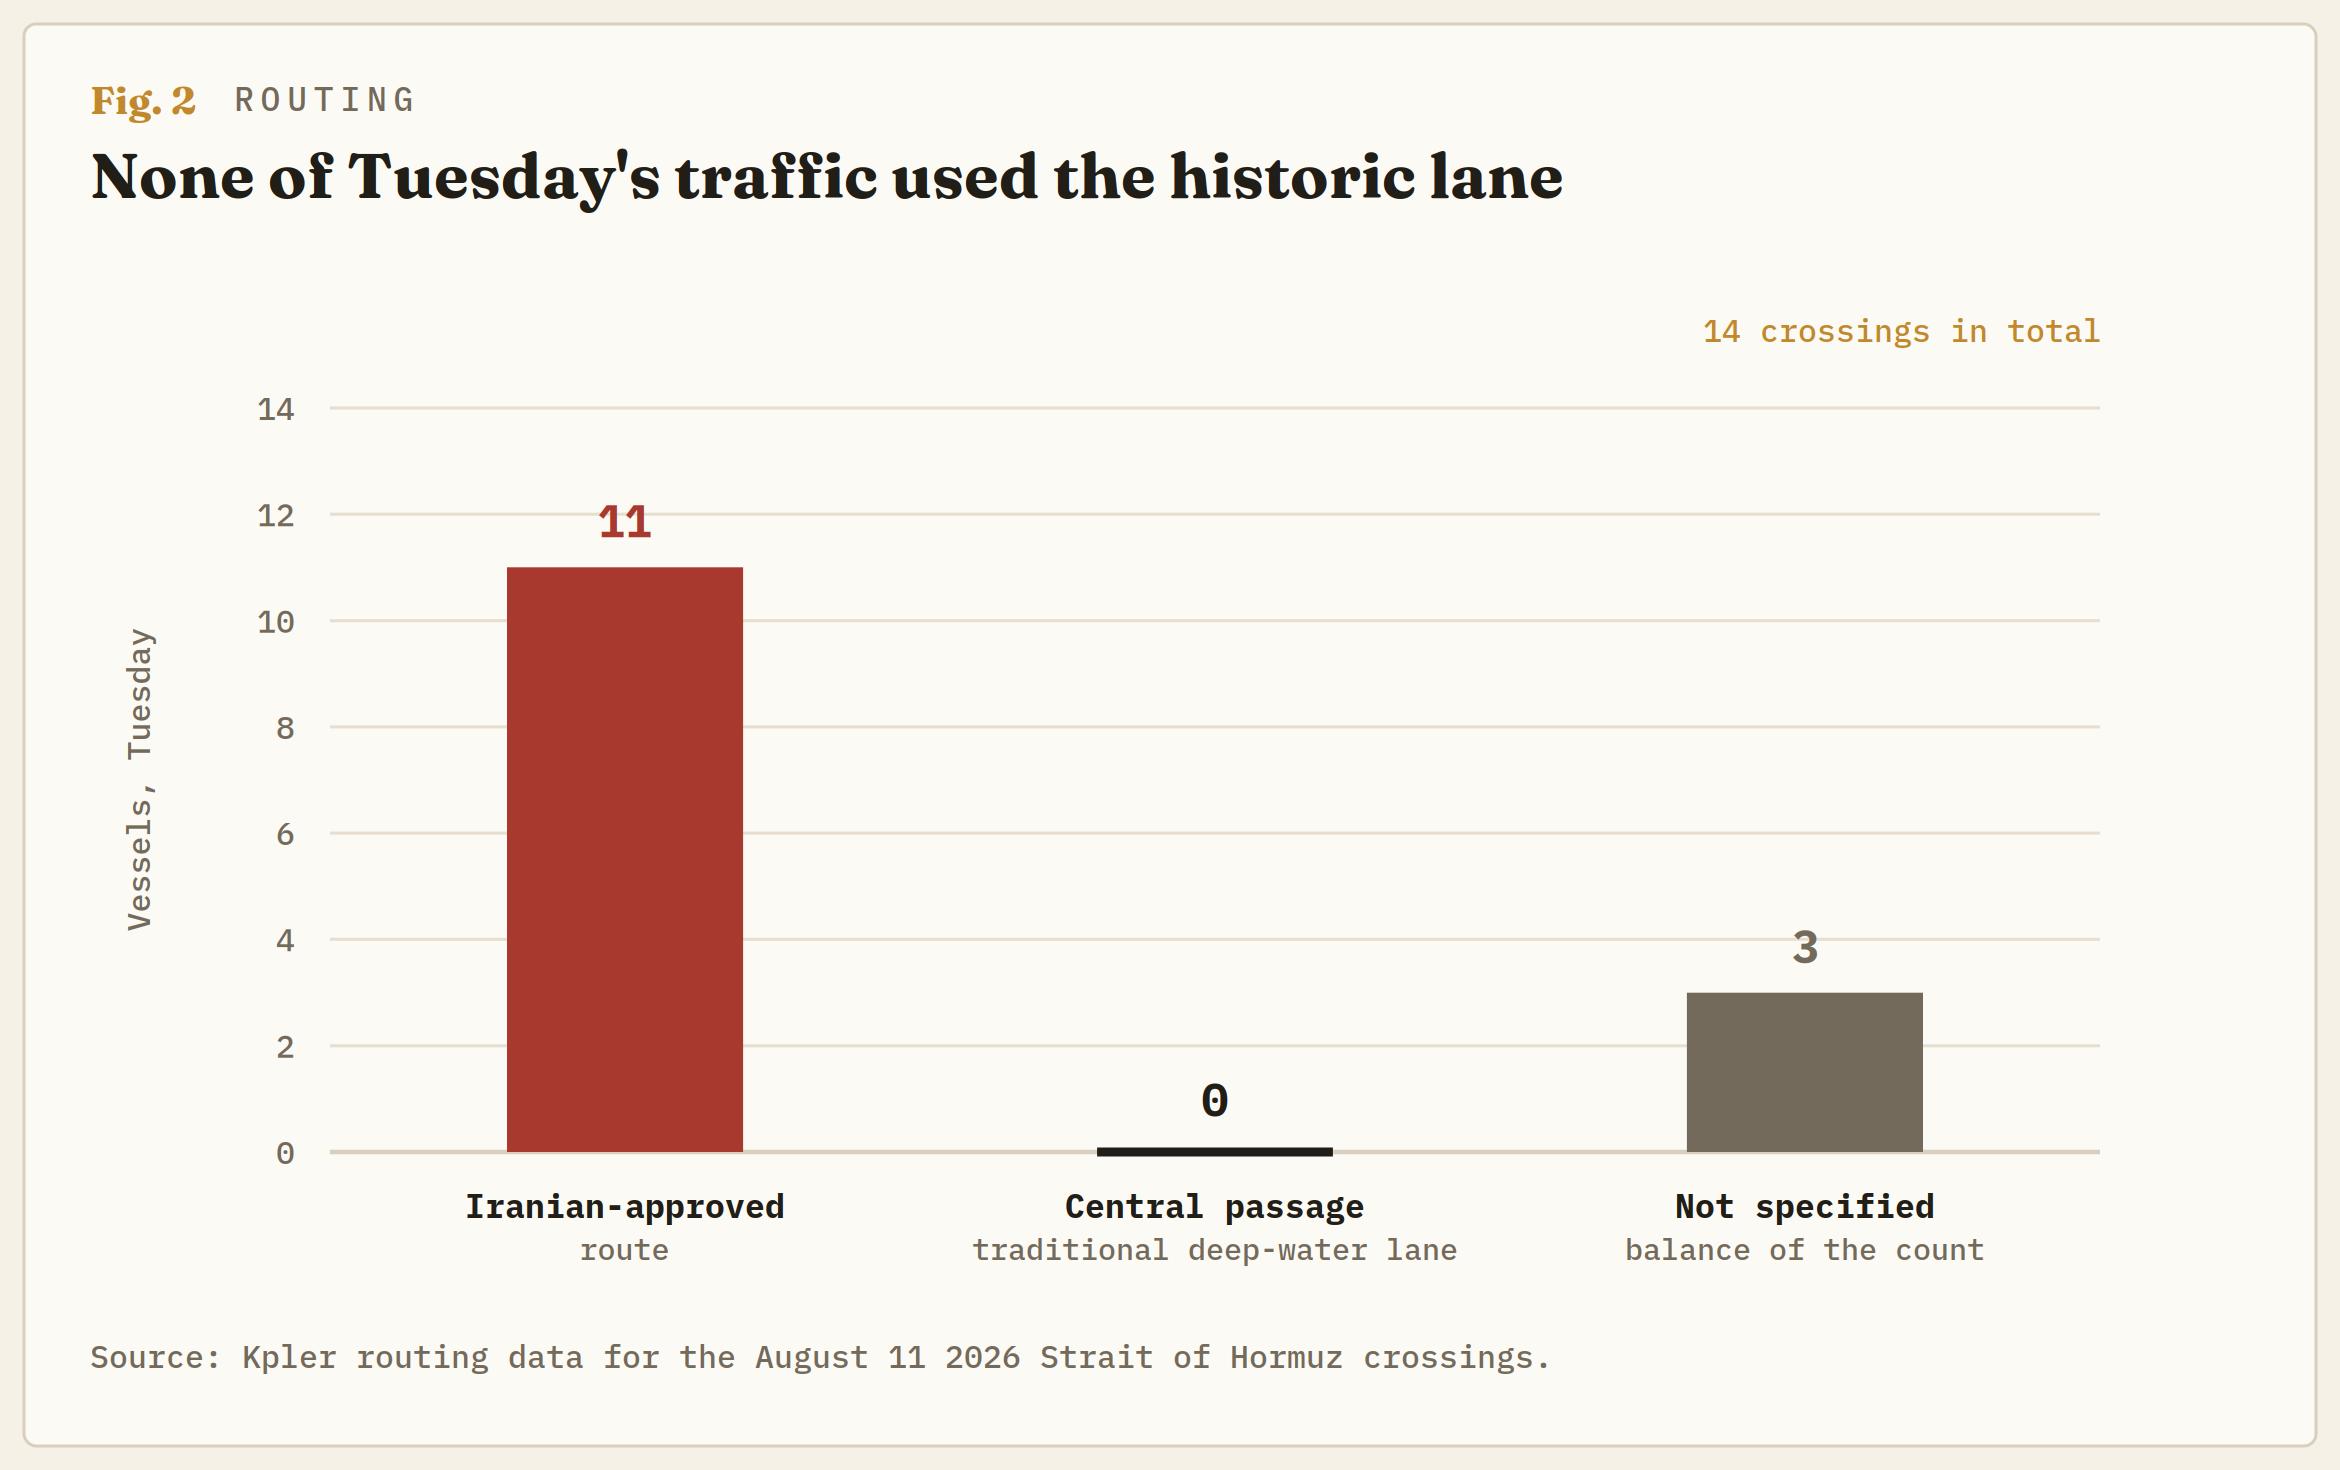
Of Tuesday's 14 crossings, 11 used the Iranian-approved route. None used the traditional central passage. That is not a strait returning to service. It is a corridor operating inside a strait, on terms set by the party that shut it, with the historic deep-water lane still empty.
The distinction is operational rather than semantic, and it is why the count stays at 14 rather than climbing. A shipowner deciding whether to send a very large crude carrier through a waterway is not pricing whether transit is currently possible. That owner is pricing whether transit remains possible for the eighteen hours the vessel is exposed, and whether the permission granted this week survives the next escalation. Permission that can be withdrawn is not the same commercial object as a strait, because insurers cannot underwrite discretion and charterers will not accept the residual.
That is the mechanism keeping traffic depressed while the political language says otherwise. The declaration changed the legal position. It did not change the risk that owners, underwriters and charterers actually price, which is the risk of being inside the strait when the arrangement lapses.
It also explains why a headline reopening produced a fall in crude rather than a rally in freight. The barrels that are moving are moving on sufferance, and a route granted at one country's discretion cannot clear the volume a strait clears.
Freight never stopped pricing the strait
There is a second market watching the same waterway, and it disagrees.
The Baltic Dirty Tanker Index, which prices the cost of moving crude by sea, sits at 2,663 as of August 11. That is up roughly a third from its early-July low near 1,988, and it trades above its 20, 60 and 120-day averages with the shortest of the three turning up through the others. It remains about 29% below the record near 3,730 set in March at the height of the disruption, so freight has retraced too. The difference is that it has turned back up, and crude has not.
Set the two against each other from the July lows. Tanker rates are pressing their recovery highs. Brent is up about a quarter from its low and has handed back close to a third of that recovery, with momentum washed out.
The divergence matters because the two numbers measure different things. Flat price is an expectation about future supply, and expectations respond to announcements. Freight is the cost of actually moving a barrel through water, and it responds to rerouting, war-risk premia, idle time and the length of the voyage. When the two disagree, freight is the one being set by people fixing ships this week.
The tape has already moved on
Both benchmarks now trade as though the chokepoint were a solved problem.
Brent opened at $87.81, reached $88.70, holds near $87.35 and is down roughly half a percent. It sits about 6% above its 200-day exponential moving average near $82.50 and about 2% above the 50-day near $85.29. The window high at $114.33 is now more than 23% away.
WTI shows the same shape with less of everything. It trades near $81.65, down about 0.7%, roughly 4.5% above its 200-day near $78 and barely 1% above its 50-day near $80.75. The spread between the two benchmarks is about $5.70.
The momentum reading is the tell on both. Daily Stoch RSI ran to the mid-nineties in late July, when the market briefly believed a deal was imminent, and now reads 24.82 on Brent and 22.76 on WTI. That is a complete round trip in three weeks with price ending higher than it started. Crude has burned through an entire momentum cycle and arrived nowhere, which is what a market does when it is waiting for a catalyst it has decided will be benign.
The asymmetry nobody is holding
Set the two data sets side by side and the risk distribution is lopsided in a way the price does not reflect.
If throughput genuinely normalises toward 120 a day, the remaining premium comes out of the barrel. That is worth something in the region of $15 on Brent, taking it back toward $70, and it would take several months of steadily rising counts to justify.
If throughput stays near 14, the current price is too low rather than too high, because a chokepoint delivering an eighth of its volume is a physical shortage that has not yet been felt in inventories. And if the route concession lapses, which is the branch nobody is positioned for, the count goes to zero and the March highs above $114 become the reference rather than the memory.
The market is pricing the first branch with the confidence of a done deal, on the strength of a declaration, while the observable count says the second branch is the one currently running.
The framework from here
Bias is for consolidation with the risk skewed higher, which is an awkward combination and precisely why the setup is interesting.
On Brent, $85 is the pivot, coinciding with the 50-day, and holding it keeps the recovery from the early-August dip intact. Beneath that, $82 is the 200-day and the line separating a pullback from a reversal, with $80 the round handle below it. To the upside, $90 is the first test and the level the late-July optimism reached, and a daily close above it opens the $95 area where the deal-is-imminent rally topped out.
On WTI the equivalents are $80 as pivot, $78 at the 200-day, and $85 above. The tighter percentage distances mean WTI gives the cleaner signal on a break in either direction, while Brent carries the chokepoint risk premium and is the better expression of the reopening question itself.
Watch the transit count rather than the headlines, and watch the routing split inside it more closely than the total. A rising count that stays concentrated on the approved route is not normalisation, it is a wider concession, and it can be revoked in an afternoon. The number that would genuinely change the picture is the first meaningful flow back through the central passage, because that is the only figure that says owners believe the strait rather than the announcement.
Watch tanker rates alongside the count. Freight rolling over would be the first honest sign that the physical difficulty is easing, and it would show up there before the flat price admits it.
Until that appears, Oil is priced for a reopening that the ships have not made.
Author

Joshua Gibson
FXStreet
Joshua joins the FXStreet team as an Economics and Finance double major from Vancouver Island University with twelve years' experience as an independent trader focusing on technical analysis.