Silver Price Prediction: XAG/USD bulls have the upper hand while above $29.20 confluence
- Silver drifts lower on Thursday, albeit holds above the $29.20 confluence hurdle breakpoint.
- The technical setup favors bulls and supports prospects for the emergence of some dip-buying.
- A sustained move beyond the $30.00 mark will set the stage for a further appreciating move.

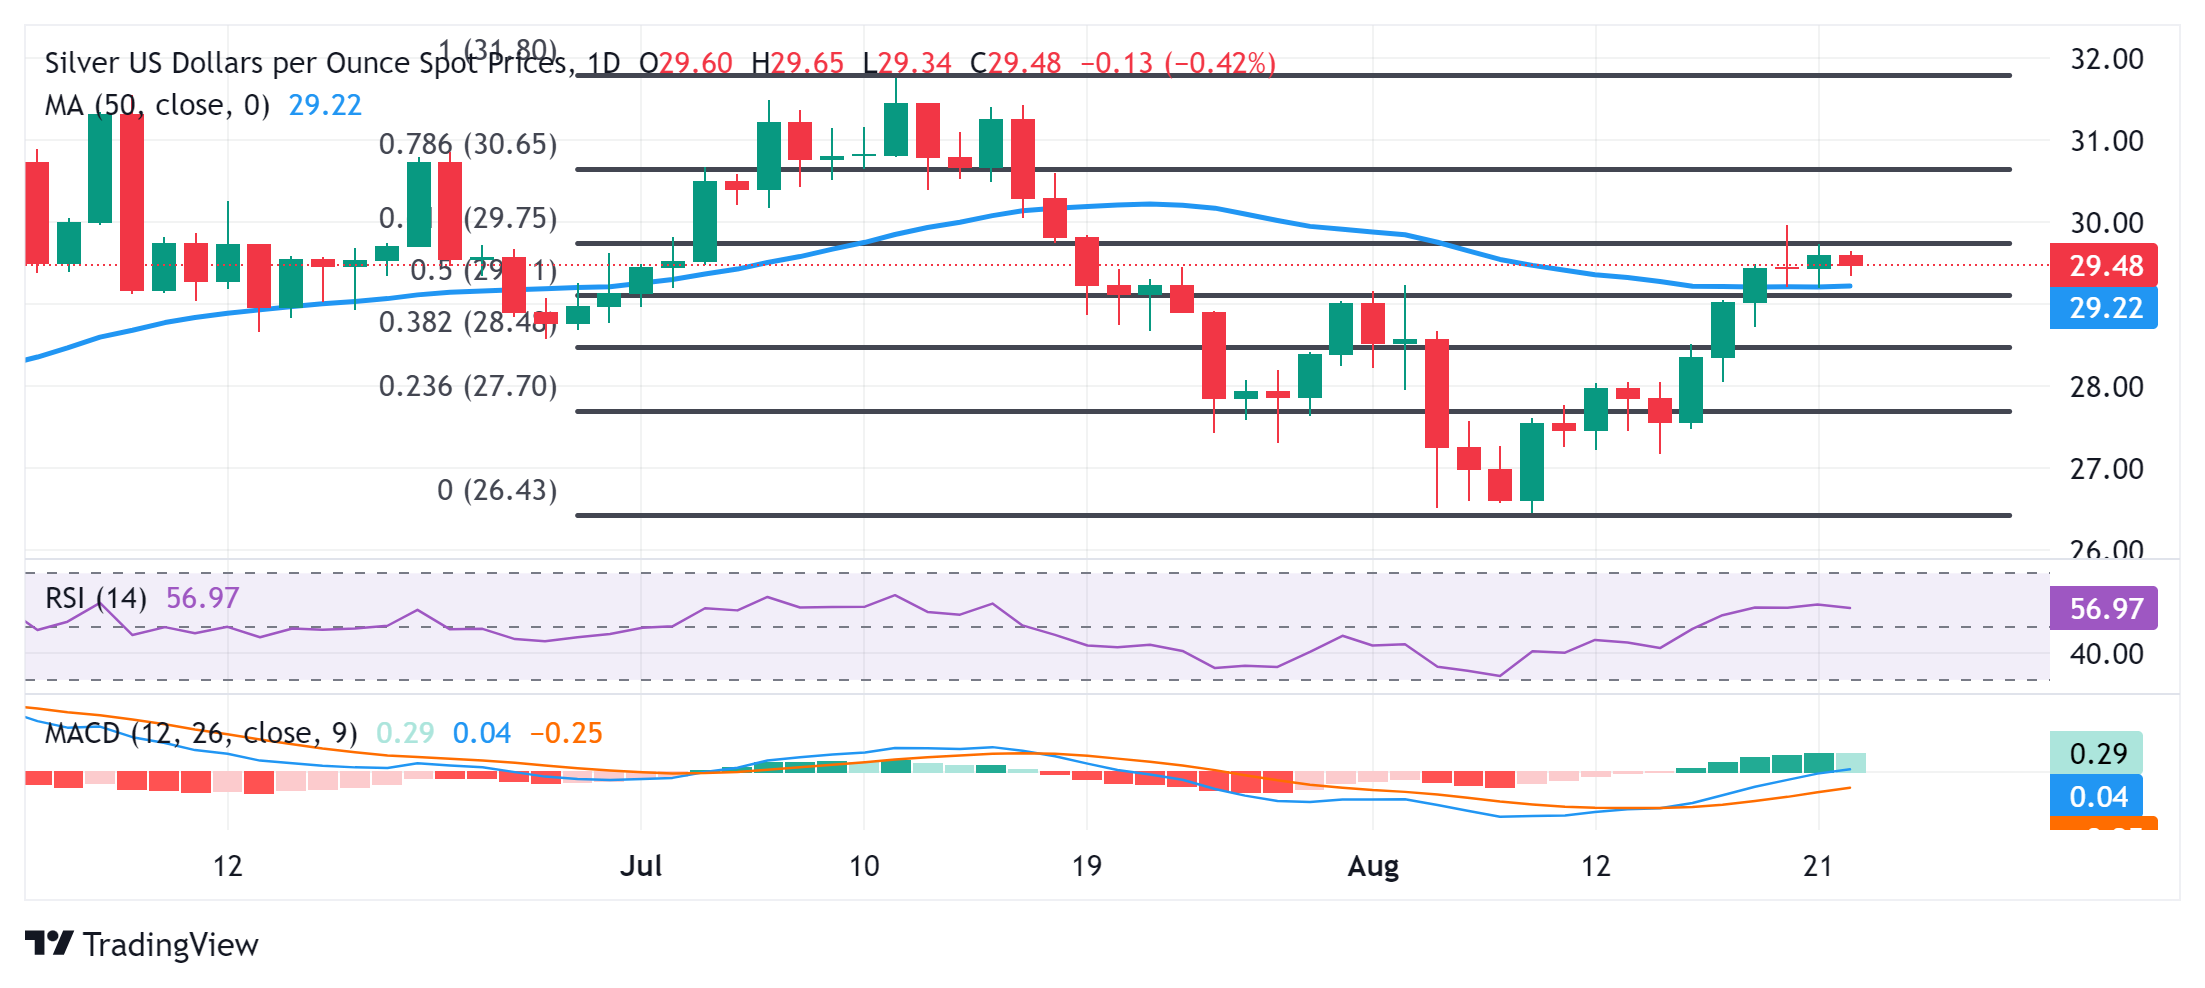
Silver (XAG/USD) attracts some sellers during the Asian session on Thursday and reverses a major part of the previous day's positive move. The white metal, however, manages to hold above the 50-day Simple Moving Average (SMA) and currently trades around mid-$29.00s, down 0.40% for the day.
The 50-day SMA, currently pegged near the $29.20 region, coincides with the 50% Fibonacci retracement level of the July-August decline and should act as a key pivotal point for the XAG/USD. Against the backdrop of Tuesday's failure near the $30.00 psychological mark, a convincing break below the said confluence might prompt some technical selling and pave the way for deeper losses.
The XAG/USD might then weaken further below the $29.00 round figure, towards testing the 38.2% Fibo. level support near the $28.55 region. Some follow-through selling has the potential to drag the white metal towards the $28.00 mark, below which the downward trajectory could extend further towards the $27.25 region en route to the next relevant support near the $27.00 round-figure mark.
That said, oscillators on the daily chart have been gaining positive traction and are far from being in the overbought zone. This supports prospects for the emergence of some dip-buying at lower levels and warrants some caution for bearish traders. That said, it will still be prudent to wait for a sustained strength beyond the $30.00 mark before positioning for any meaningful appreciating move.
The subsequent move-up will set the stage for a move towards the $30.55-$30.60 area, or the 78.6% Fibo. level, above which the XAG/USD could aim to reclaim the $31.00 mark. The XAG/USD might then accelerate the momentum further towards the $31.30-$31.40 supply zone en route to the July swing high, around the $31.75 region, the $32.00 level and the $32.50 area, or the YTD peak touched in May.
Silver daily chart
Silver FAQs
Silver is a precious metal highly traded among investors. It has been historically used as a store of value and a medium of exchange. Although less popular than Gold, traders may turn to Silver to diversify their investment portfolio, for its intrinsic value or as a potential hedge during high-inflation periods. Investors can buy physical Silver, in coins or in bars, or trade it through vehicles such as Exchange Traded Funds, which track its price on international markets.
Silver prices can move due to a wide range of factors. Geopolitical instability or fears of a deep recession can make Silver price escalate due to its safe-haven status, although to a lesser extent than Gold's. As a yieldless asset, Silver tends to rise with lower interest rates. Its moves also depend on how the US Dollar (USD) behaves as the asset is priced in dollars (XAG/USD). A strong Dollar tends to keep the price of Silver at bay, whereas a weaker Dollar is likely to propel prices up. Other factors such as investment demand, mining supply – Silver is much more abundant than Gold – and recycling rates can also affect prices.
Silver is widely used in industry, particularly in sectors such as electronics or solar energy, as it has one of the highest electric conductivity of all metals – more than Copper and Gold. A surge in demand can increase prices, while a decline tends to lower them. Dynamics in the US, Chinese and Indian economies can also contribute to price swings: for the US and particularly China, their big industrial sectors use Silver in various processes; in India, consumers’ demand for the precious metal for jewellery also plays a key role in setting prices.
Silver prices tend to follow Gold's moves. When Gold prices rise, Silver typically follows suit, as their status as safe-haven assets is similar. The Gold/Silver ratio, which shows the number of ounces of Silver needed to equal the value of one ounce of Gold, may help to determine the relative valuation between both metals. Some investors may consider a high ratio as an indicator that Silver is undervalued, or Gold is overvalued. On the contrary, a low ratio might suggest that Gold is undervalued relative to Silver.
Author

Haresh Menghani
FXStreet
Haresh Menghani is a detail-oriented professional with 10+ years of extensive experience in analysing the global financial markets.


