Silver Price Forecast: XAG/USD wobbles around $38, awaits clarity on US-EU trade talks
- Silver price oscillates in a tight range around $38, with investors awaiting more news regarding trade talks between the US and the EU.
- EU trade chief Sefcovic headed to Washington for fresh round of trade talks.
- Fed officials warned of accelerating inflationary pressures due to Trump’s tariffs.

Silver price (XAG/USD) trades in a tight range around $38 during the Asian trading session on Wednesday. The white metal consolidates as investors await more cues regarding trade talks between the United States (US) and the European Union (EU).
On Wednesday, US President Donald Trump stated that Washington could possibly has a deal with the EU, while expressing confidence that a trade pact with India is on the horizon.
"We’re very close to India, and we could possibly make a deal with EU, Trump said in an interview aired on Real America’s Voice.
Trump’s comments came at a time when EU trade chief Maros Sefcovic was headed to Washington on Wednesday for next round of trade talks.
Given that the EU is one of leading trading partners of the US, trade tensions between both economies would impact global trade order. Theoretically, the Silver price outperforms in a heightened globally uncertain environment.
Meanwhile, escalating fears that the US inflation will heat up further when additional tariffs imposed by the US on its trading partners will become effective from August 1 are expected to keep supporting the Silver price. Silver tends to perform better in a high-inflation environment.
On Wednesday, New York Federal Reserve (Fed) Bank President John Williams and Atlanta Fed Bank President Raphael Bostic warned that the impact of tariffs on inflation has just started building up and it will accelerate going ahead.
“It's early days for impact of tariffs on economy, which is modest so far but will increase over time,” New York Fed Bank President John Williams said.
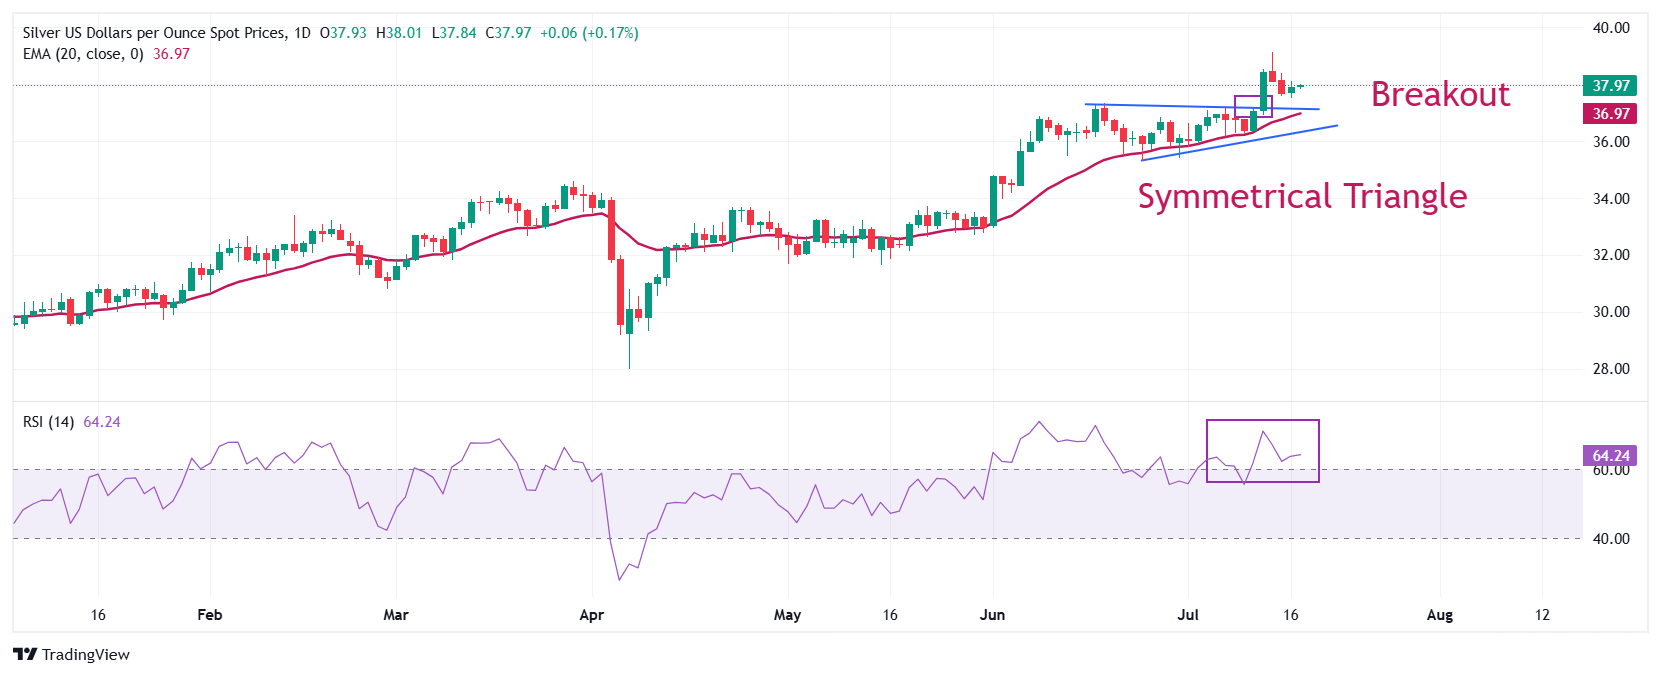
Silver technical analysis
Silver price holds the breakout of the Symmetrical Triangle formation on a daily timeframe, which led it to post a fresh over-a-decade high around $39.13.
Upward-sloping 20-day Exponential Moving Average (EMA) near $37 suggests that the near-term trend is bullish.
The 14-day Relative Strength Index (RSI) oscillates inside the 60.00-80.00 range, indicating a strong bullish momentum.
Looking up, the round-level of $40.00 will be a key barrier for the Silver price. On the downside, the 20-day EMA will act as a key support.
Silver daily chart
Silver FAQs
Silver is a precious metal highly traded among investors. It has been historically used as a store of value and a medium of exchange. Although less popular than Gold, traders may turn to Silver to diversify their investment portfolio, for its intrinsic value or as a potential hedge during high-inflation periods. Investors can buy physical Silver, in coins or in bars, or trade it through vehicles such as Exchange Traded Funds, which track its price on international markets.
Silver prices can move due to a wide range of factors. Geopolitical instability or fears of a deep recession can make Silver price escalate due to its safe-haven status, although to a lesser extent than Gold's. As a yieldless asset, Silver tends to rise with lower interest rates. Its moves also depend on how the US Dollar (USD) behaves as the asset is priced in dollars (XAG/USD). A strong Dollar tends to keep the price of Silver at bay, whereas a weaker Dollar is likely to propel prices up. Other factors such as investment demand, mining supply – Silver is much more abundant than Gold – and recycling rates can also affect prices.
Silver is widely used in industry, particularly in sectors such as electronics or solar energy, as it has one of the highest electric conductivity of all metals – more than Copper and Gold. A surge in demand can increase prices, while a decline tends to lower them. Dynamics in the US, Chinese and Indian economies can also contribute to price swings: for the US and particularly China, their big industrial sectors use Silver in various processes; in India, consumers’ demand for the precious metal for jewellery also plays a key role in setting prices.
Silver prices tend to follow Gold's moves. When Gold prices rise, Silver typically follows suit, as their status as safe-haven assets is similar. The Gold/Silver ratio, which shows the number of ounces of Silver needed to equal the value of one ounce of Gold, may help to determine the relative valuation between both metals. Some investors may consider a high ratio as an indicator that Silver is undervalued, or Gold is overvalued. On the contrary, a low ratio might suggest that Gold is undervalued relative to Silver.
Author

Sagar Dua
FXStreet
Sagar Dua is associated with the financial markets from his college days. Along with pursuing post-graduation in Commerce in 2014, he started his markets training with chart analysis.


