Silver Price Forecast: XAG/USD to further extend its correction towards $25.00
- Silver Price plummeted more than 2.5% as the US 10-year yield closed to the 2.95% threshold.
- US Real Yields turned positive for the first time since March 2020, a headwind for silver.
- Silver Price Forecast (XAG/USD): Further correction lies below $25.81.

Silver (XAG/USD) records its most significant daily loss since March 29, plunging 2.68% during the day, amidst surging US Treasury yields led by the short-end and a firm US dollar. At the time of writing, XAG/USD is trading at $25.17
Fed speaking and an upbeat sentiment weighed on precious metals
As reflected by US equities ending the day with gains, a risk-on market mood kept investors turning towards riskier assets. Consequently, the precious metals complex suffered, on the back of Fed speaking, which triggered a jump in US Treasury yields.
On Monday, St. Louis Federal Reserve President James Bullard reiterated his case for increasing interest rates to 3.5% by the end of 22 to slow 40-year-high inflation readings, as he said that US inflation is “far too high.”
Additionally to St. Louis Fed Bullard, on Tuesday, Chicago’s Fed President Charles Evans said that the US economy “will do very well even as rates rise.” Evans added that he supports a “couple” of 50 bps increases, which could lift rates to the 1.25%-2.50% neutral rate.
In the meantime, money market futures expect the Federal Funds Rates to rise to 1.31% in June and 2.76% next February, from 0.33% now.
It is worth noting that the 10-year TIPS broke above negative territory during the day, up to 0.005%, for the first time since March 2020, a headwind for the white metal. The Treasury Inflation-Protected Securities (TIPS) are also called real yields because they subtract projected inflation from the nominal yield on Treasury securities.
Silver Price Forecast (XAG/USD): Technical outlook
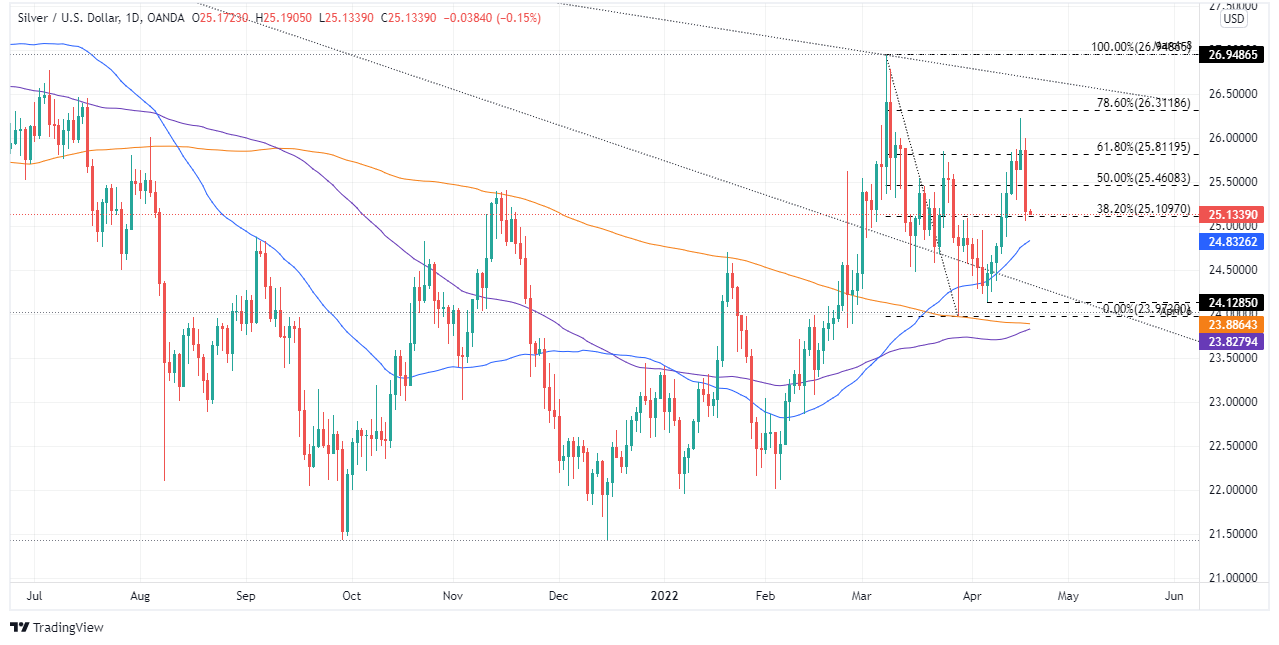
Silver (XAG/USD) is still upward biased, despite Tuesday’s fall. However, failure at the 78.60% Fibonacci level at $26.31 opened the door that exacerbated the break to the downside of the 61.80% and 50% Fibonacci retracement, but the 38.20% Fibonacci level at $25.10, capped XAG/USD’s nosedive.
In the scenario of XAG/USD extending its correction, the first support would be $25.10, the 38.20% Fibonacci retracement. A breach of the latter would expose the $25.00 figure, followed by the 50-day moving average (DMA) at $24.83 and then April’s six cycle low at $24.12.
On the flip side, if XAG/USD’s are to regain control, they need a break above $25.81, the 61.80% Fibonacci level. That said, the XAG/USD first resistance would be $26.00, followed by the 78.60% Fibonacci retracement at $26.31.
Author

Christian Borjon Valencia
FXStreet
Markets analyst, news editor, and trading instructor with over 14 years of experience across FX, commodities, US equity indices, and global macro markets.

















