Silver Price Forecast: XAG/USD struggles near mid-$47.00s amid mixed technical signals
- Silver edges lower during the Asian session, though it lacks follow-through selling.
- The mixed technical setup warrants caution before placing fresh directional bets.
- A sustained move above the $48.00 mark would be seen as a key trigger for bulls.

Silver (XAG/USD) struggles to find acceptance above the $48.00 round figure and attracts some sellers during the Asian session on Thursday. The white metal, however, manages to hold comfortably above its lowest level since September 25, touched on Tuesday, and currently trades just below mid-$47.00s, down 0.20% for the day.
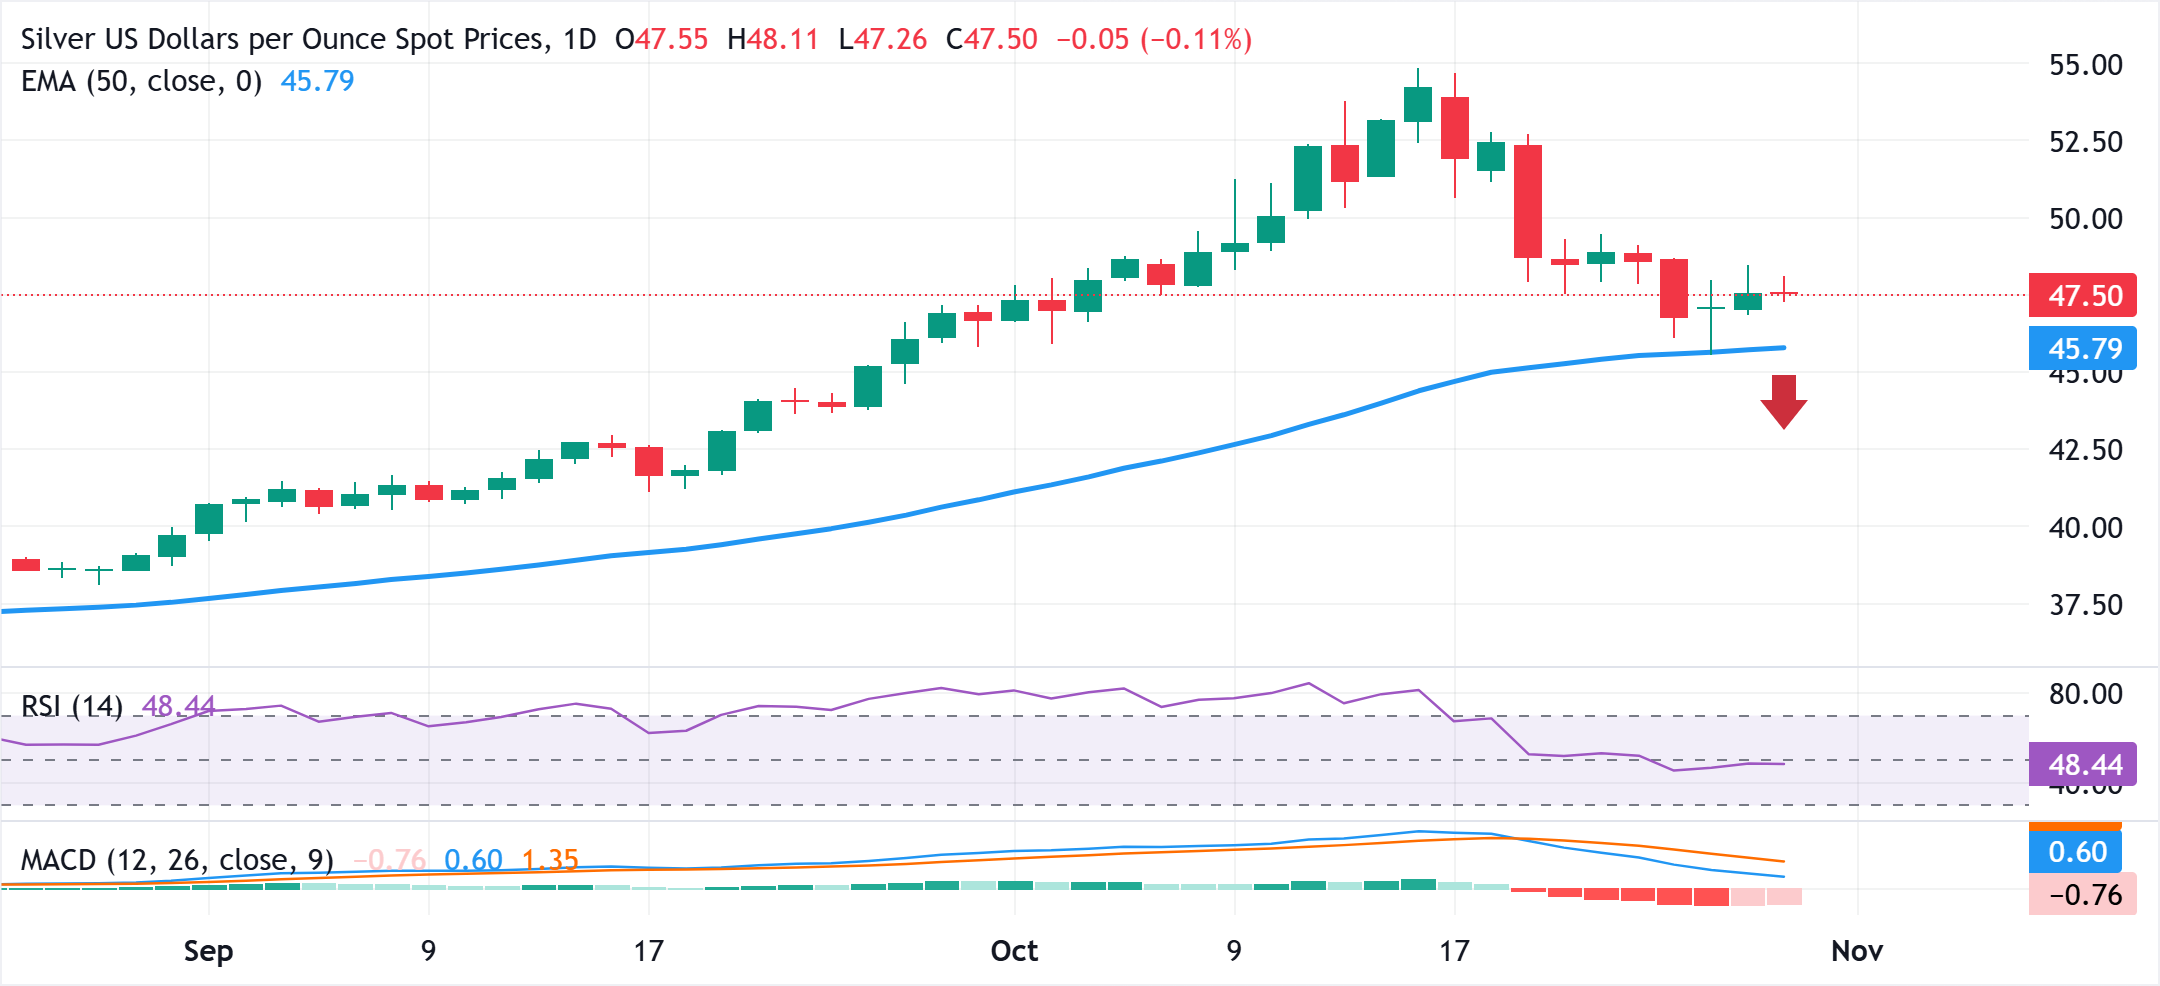
From a technical perspective, this week's rebound from the 50-day Exponential Moving Average (SMA) and the subsequent move up favor the XAG/USD bulls. However, oscillators on the daily chart have just started gaining negative traction. This, in turn, warrants some caution before confirming that the recent corrective decline from the all-time peak touched earlier this month might have run its course.
Meanwhile, the $47.00-$46.95 area now seems to protect the immediate downside, below which the XAG/USD could slide back below the $46.00 mark and retest the 50-day EMA support near the $45.55 . A convincing break below might be seen as a fresh trigger for bearish traders and drag the commodity to the $45.00 psychological mark en route to the $44.45 region, the $44.00 mark, and the $43.55 area.
On the flip side, any positive move beyond the $48.00 round figure is likely to attract some sellers and face a strong barrier near the $48.45-$48.50 region. Some follow-through buying should pave the way for a move towards the $49.00 mark, which, if cleared, should allow the XAG/USD to extend the momentum towards the $49.45 region before aiming to reclaim the $50.00 psychological mark.
Silver daily chart
Silver FAQs
Silver is a precious metal highly traded among investors. It has been historically used as a store of value and a medium of exchange. Although less popular than Gold, traders may turn to Silver to diversify their investment portfolio, for its intrinsic value or as a potential hedge during high-inflation periods. Investors can buy physical Silver, in coins or in bars, or trade it through vehicles such as Exchange Traded Funds, which track its price on international markets.
Silver prices can move due to a wide range of factors. Geopolitical instability or fears of a deep recession can make Silver price escalate due to its safe-haven status, although to a lesser extent than Gold's. As a yieldless asset, Silver tends to rise with lower interest rates. Its moves also depend on how the US Dollar (USD) behaves as the asset is priced in dollars (XAG/USD). A strong Dollar tends to keep the price of Silver at bay, whereas a weaker Dollar is likely to propel prices up. Other factors such as investment demand, mining supply – Silver is much more abundant than Gold – and recycling rates can also affect prices.
Silver is widely used in industry, particularly in sectors such as electronics or solar energy, as it has one of the highest electric conductivity of all metals – more than Copper and Gold. A surge in demand can increase prices, while a decline tends to lower them. Dynamics in the US, Chinese and Indian economies can also contribute to price swings: for the US and particularly China, their big industrial sectors use Silver in various processes; in India, consumers’ demand for the precious metal for jewellery also plays a key role in setting prices.
Silver prices tend to follow Gold's moves. When Gold prices rise, Silver typically follows suit, as their status as safe-haven assets is similar. The Gold/Silver ratio, which shows the number of ounces of Silver needed to equal the value of one ounce of Gold, may help to determine the relative valuation between both metals. Some investors may consider a high ratio as an indicator that Silver is undervalued, or Gold is overvalued. On the contrary, a low ratio might suggest that Gold is undervalued relative to Silver.
Author

Haresh Menghani
FXStreet
Haresh Menghani is a detail-oriented professional with 10+ years of extensive experience in analysing the global financial markets.


