Silver Price Forecast: XAG/USD struggles for traction, bulls eye $49.50 breakout
- Silver extends its consolidation phase for a second straight week amid muted volatility.
- Momentum indicators remain neutral, suggesting neither bulls nor bears have control.
- Broader uptrend remains intact as Silver holds well above its 100-day moving average.

Silver (XAG/USD) trades little changed on Friday, hovering near $48.30 at the time of writing after easing from intraday highs, as the market remains directionless heading into the weekend. The metal has struggled to find fresh catalysts this week, consolidating within a narrow band despite lingering uncertainty in global markets.
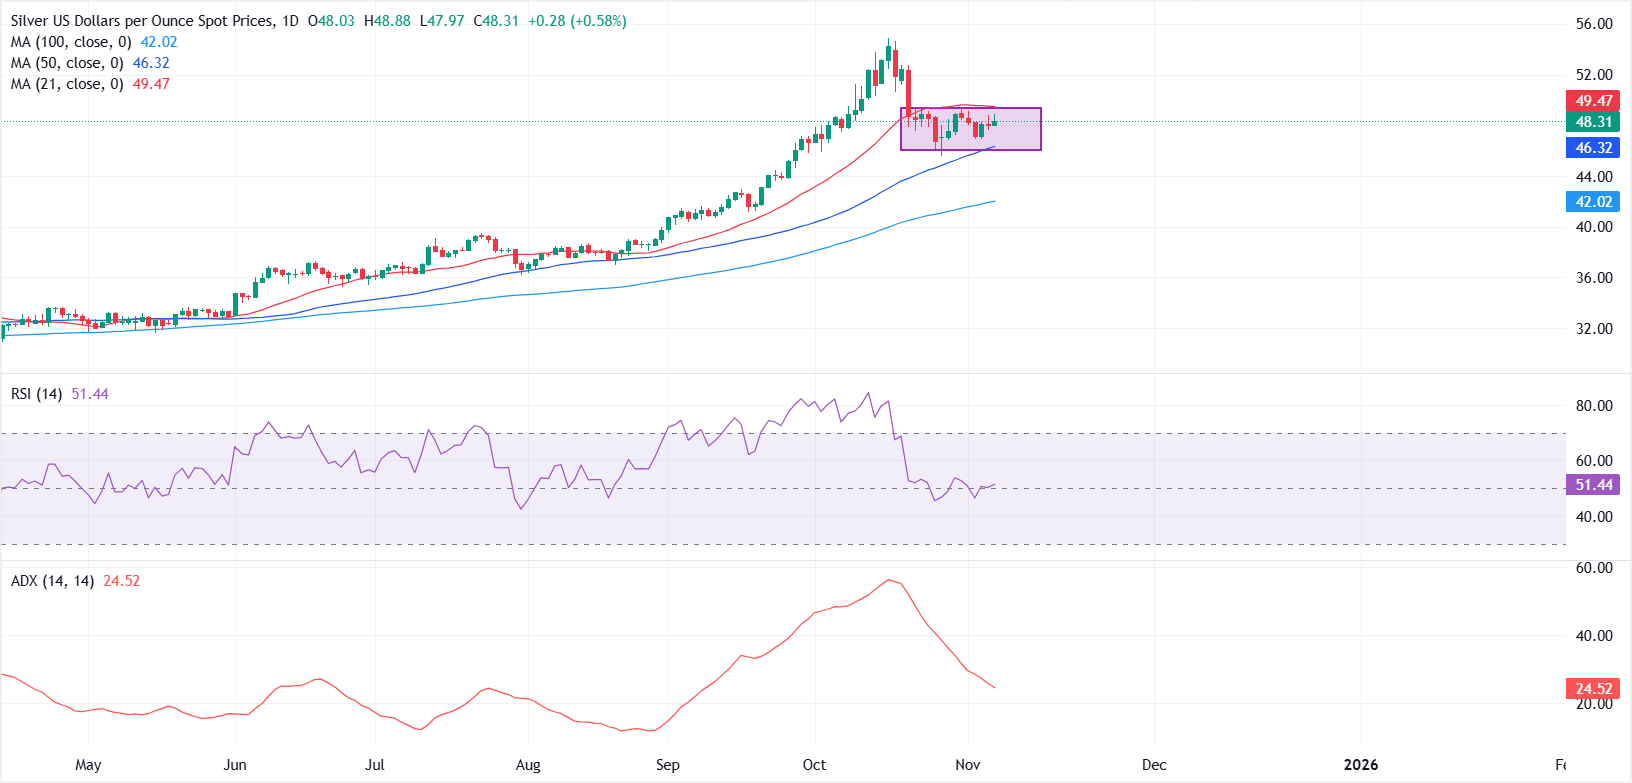
The metal has been consolidating within a well-defined horizontal range between $46.00 and $49.50 for nearly two weeks, reflecting an accumulation phase following its sharp retreat from the record high of $54.86 reached on October 16.
The 21-day Simple Moving Average (SMA) near $49.46, and the 50-day SMA around $46.32 have become key technical reference points, effectively containing price action and keeping volatility subdued. Momentum indicators echo the neutral tone, with the Relative Strength Index (RSI) hovering near 50 and the Average Directional Index (ADX) around 24, suggesting limited conviction from both bulls and bears.
The broader trend, however, remains constructive, as Silver continues to trade well above the 100-day SMA at $42.00, keeping the medium-term bias tilted to the upside.
With prices failing to sustain upside traction, Silver is on course to end the week with marginal losses. A break above $49.50 could spark renewed bullish momentum toward $52.00 and $54.86, while a close below $46.00 may invite fresh selling toward the 100-day SMA, where dip buyers could re-emerge.
Silver FAQs
Silver is a precious metal highly traded among investors. It has been historically used as a store of value and a medium of exchange. Although less popular than Gold, traders may turn to Silver to diversify their investment portfolio, for its intrinsic value or as a potential hedge during high-inflation periods. Investors can buy physical Silver, in coins or in bars, or trade it through vehicles such as Exchange Traded Funds, which track its price on international markets.
Silver prices can move due to a wide range of factors. Geopolitical instability or fears of a deep recession can make Silver price escalate due to its safe-haven status, although to a lesser extent than Gold's. As a yieldless asset, Silver tends to rise with lower interest rates. Its moves also depend on how the US Dollar (USD) behaves as the asset is priced in dollars (XAG/USD). A strong Dollar tends to keep the price of Silver at bay, whereas a weaker Dollar is likely to propel prices up. Other factors such as investment demand, mining supply – Silver is much more abundant than Gold – and recycling rates can also affect prices.
Silver is widely used in industry, particularly in sectors such as electronics or solar energy, as it has one of the highest electric conductivity of all metals – more than Copper and Gold. A surge in demand can increase prices, while a decline tends to lower them. Dynamics in the US, Chinese and Indian economies can also contribute to price swings: for the US and particularly China, their big industrial sectors use Silver in various processes; in India, consumers’ demand for the precious metal for jewellery also plays a key role in setting prices.
Silver prices tend to follow Gold's moves. When Gold prices rise, Silver typically follows suit, as their status as safe-haven assets is similar. The Gold/Silver ratio, which shows the number of ounces of Silver needed to equal the value of one ounce of Gold, may help to determine the relative valuation between both metals. Some investors may consider a high ratio as an indicator that Silver is undervalued, or Gold is overvalued. On the contrary, a low ratio might suggest that Gold is undervalued relative to Silver.
Author

Vishal Chaturvedi
FXStreet
I am a macro-focused research analyst with over four years of experience covering forex and commodities market. I enjoy breaking down complex economic trends and turning them into clear, actionable insights that help traders stay ahead of the curve.


