Silver Price Forecast: XAG/USD steadies near $38.50, eyes breakout above $39.00
- Silver is trading around $38.50 on Monday, recovering from last week’s mild pullback.
- Momentum indicators on the hourly chart suggest an upside bias, with the RSI near 70 and the ADX turning higher.
- Immediate key resistance is seen at the $39.00 psychological level and the July 14 high of $39.13, while support is located at the $38.00 round number and the $37.50 demand zone.

Silver (XAG/USD) starts the week on firmer ground after a mild pullback last week. As of now, the metal is trading near $38.50 during the early American trading hours on Monday, just shy of the multi-year high of $39.13 set on July 14. Although the recent rally has lost some momentum, technical indicators are turning bullish again across both short-term and longer-term charts.
The rebound is also supported by a softer US Dollar, which is trading under pressure on Monday amid easing Treasury yields and cautious risk sentiment.
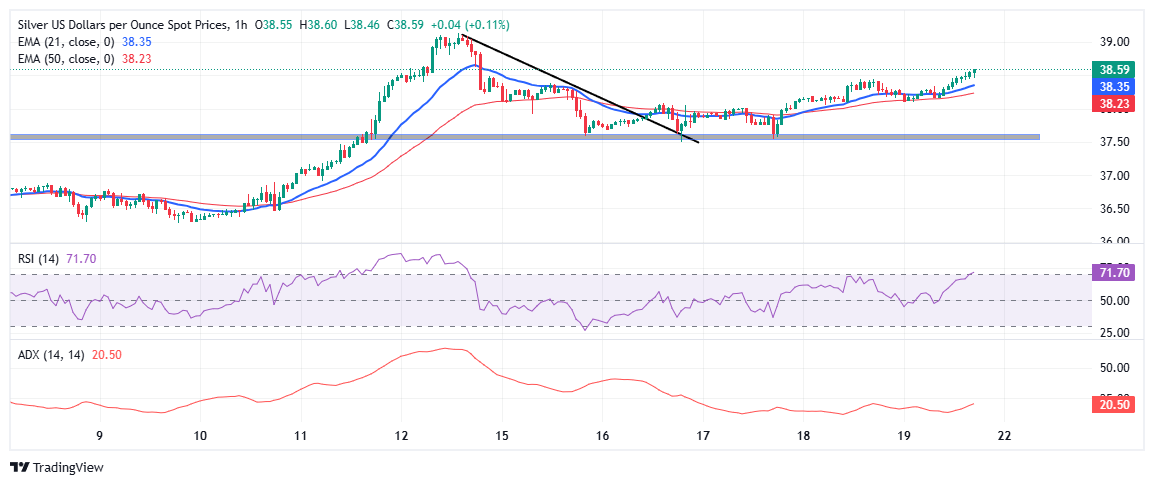
On the hourly chart, Silver is showing signs of renewed strength after forming a local bottom near $37.50, following a break above a descending trendline. The spot price now holds above both the 50- and 21-period Exponential Moving Averages (EMAs). Both moving averages are sloping slightly upward and acting as dynamic intraday support, indicating fresh buying interest.
Momentum is also firming up. The Relative Strength Index (RSI) has climbed into the overbought zone near 70, reflecting strong bullish momentum. While slightly stretched, the setup remains constructive as long as the RSI holds above 60. Meanwhile, the Average Directional Index (ADX) is pointing north currently at 20, hinting at a possible strengthening in trend momentum. However, a confirmed breakout above the $38.80-$39.00 resistance band could quickly ignite a stronger directional push.
Key short-term levels:
- Resistance: $39.00 psychological zone followed by $39.13 July 14 high.
- Support: $38.00 round number, $37.50 demand zone, and 21-EMA at $38.36 followed by 50-EMA at $38.24.
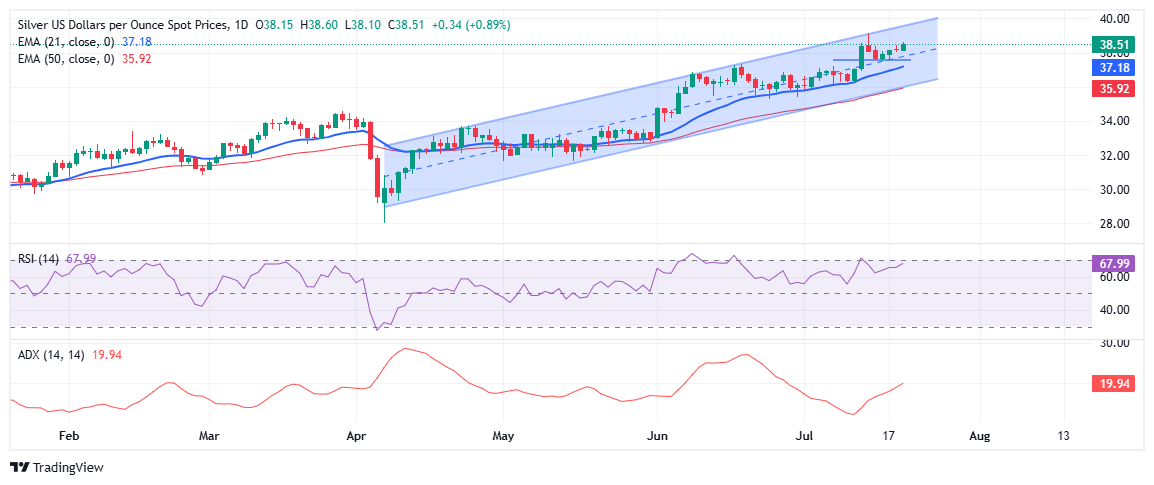
Zooming out to the daily chart, Silver remains firmly embedded in an uptrend, supported by a clearly defined ascending channel that has held since early April. The recent rally to $39.13 shows strong buying interest in Silver, supported by ongoing economic uncertainty and global tensions.
Despite last week’s modest pullback from multi-year highs, the broader structure remains intact. Silver continues to trade comfortably above the 21-day EMA at $37.18 and the 50-day EMA at $35.92—both serving as solid dynamic support and aligning with the lower boundary of the rising channel.
The RSI is nearing the overbought level, currently at 68, indicating buyers are gaining strength. Meanwhile, the ADX has increased to 20.00, showing that the trend is in its early stages. As long as Silver holds above the $37.00-$37.50 region, the broader bullish bias remains intact. A decisive breakout above $39.13 could pave the way for a run toward the key psychological barrier at $40.00.
Silver FAQs
Silver is a precious metal highly traded among investors. It has been historically used as a store of value and a medium of exchange. Although less popular than Gold, traders may turn to Silver to diversify their investment portfolio, for its intrinsic value or as a potential hedge during high-inflation periods. Investors can buy physical Silver, in coins or in bars, or trade it through vehicles such as Exchange Traded Funds, which track its price on international markets.
Silver prices can move due to a wide range of factors. Geopolitical instability or fears of a deep recession can make Silver price escalate due to its safe-haven status, although to a lesser extent than Gold's. As a yieldless asset, Silver tends to rise with lower interest rates. Its moves also depend on how the US Dollar (USD) behaves as the asset is priced in dollars (XAG/USD). A strong Dollar tends to keep the price of Silver at bay, whereas a weaker Dollar is likely to propel prices up. Other factors such as investment demand, mining supply – Silver is much more abundant than Gold – and recycling rates can also affect prices.
Silver is widely used in industry, particularly in sectors such as electronics or solar energy, as it has one of the highest electric conductivity of all metals – more than Copper and Gold. A surge in demand can increase prices, while a decline tends to lower them. Dynamics in the US, Chinese and Indian economies can also contribute to price swings: for the US and particularly China, their big industrial sectors use Silver in various processes; in India, consumers’ demand for the precious metal for jewellery also plays a key role in setting prices.
Silver prices tend to follow Gold's moves. When Gold prices rise, Silver typically follows suit, as their status as safe-haven assets is similar. The Gold/Silver ratio, which shows the number of ounces of Silver needed to equal the value of one ounce of Gold, may help to determine the relative valuation between both metals. Some investors may consider a high ratio as an indicator that Silver is undervalued, or Gold is overvalued. On the contrary, a low ratio might suggest that Gold is undervalued relative to Silver.
Author

Vishal Chaturvedi
FXStreet
I am a macro-focused research analyst with over four years of experience covering forex and commodities market. I enjoy breaking down complex economic trends and turning them into clear, actionable insights that help traders stay ahead of the curve.


