Silver Price Forecast: XAG/USD sees upside above $33.40 on soft US PPI and CPI, Trump tariff fears
- Silver price aims to break above the key resistance of $33.40 due to multiple tailwinds.
- The US CPI and PPI cooled down at a faster-than-expected pace in February.
- The tariff policy of US President Trump has strengthened safe-haven bets.

Silver price (XAG/USD) trades close to near the monthly high of $33.40 in North American trading hours on Thursday. The white metal strengthens as cooling United States (US) consumer and producer inflationary pressures pave the way for the Federal Reserve (Fed) to cut interest rates in the June policy meeting.
The US Producer Price Index (PPI) report showed that the headline and core producer inflation decelerated at a faster-than-expected pace to 3.2% and 3.4%, respectively, in 12 months to February. Month-on-month headline PPI remained flat while the core figure deflated by 0.1%.
On Wednesday, the US headline and core Consumer Price Index (CPI) rose by 2.8% and 3.1%, respectively, in February slower than their estimates and their prior releases.
Last week, Fed Chair Jerome Powell stated that the restrictive monetary policy stance won’t long last “if the labor market unexpectedly weakens or inflation falls more than expected”. The scenario of lower interest rates by the Fed bodes well for non-yielding assets, such as Silver.
On the global front, escalating economic risks due to US President Donald Trump’s tariff agenda have also improved the safe-haven demand of the Silver price. On Wednesday, Trump confirmed that he will respond to counter-tariffs from the European Union (EU). Such a scenario would result in the EU-US trade war, which will diminish the risk appetite of investors significantly.
The cautious market sentiment has also increased the safe-haven demand of the US Dollar (USD) but US economic risks and soft CPI report have capped its upside. The US Dollar Index (DXY), which tracks the Greenback’s value against six major currencies, rises to near 103.80 from its four-month low of 103.20, which it posted on Tuesday.
Silver technical analysis
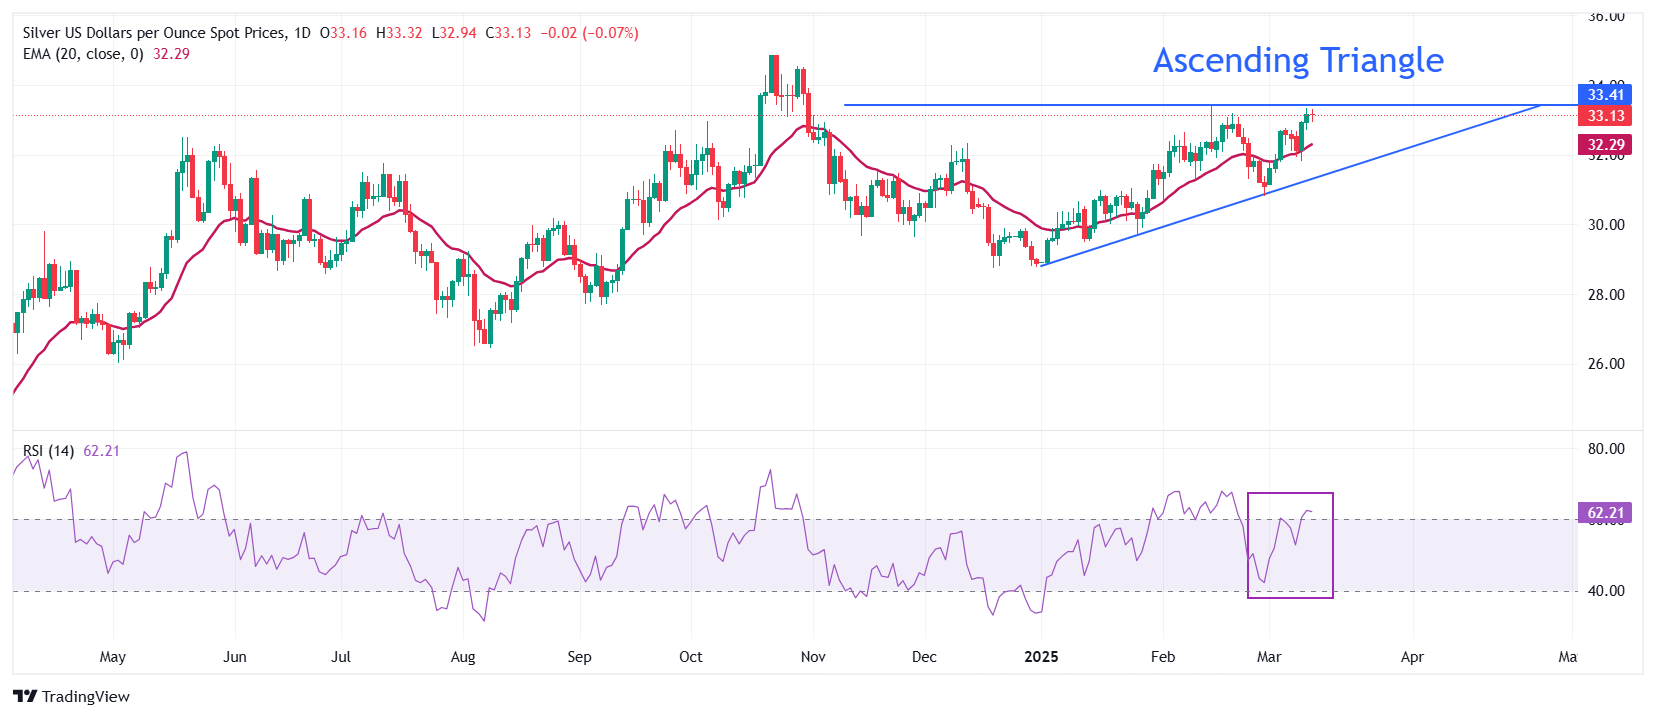
Silver price trades near the horizontal border of the Ascending Triangle chart pattern on a daily timeframe, which is placed from the February 14 high of $33.40. The upward-sloping border is placed from the December 31 low of $28.78. The above-mentioned chart pattern indicates indecisiveness among market participants.
The 20-day Exponential Moving Average (EMA) near $32.30, continues to support the Silver price.
The 14-day Relative Strength Index (RSI) climbs above 60.00. A bullish momentum would trigger if the RSI sustains above that level.
Looking down, the psychological level of $30.00 will act as key support for the Silver price. While, the October 22 high of $34.87 will be the major barrier.
Silver daily chart
Silver FAQs
Silver is a precious metal highly traded among investors. It has been historically used as a store of value and a medium of exchange. Although less popular than Gold, traders may turn to Silver to diversify their investment portfolio, for its intrinsic value or as a potential hedge during high-inflation periods. Investors can buy physical Silver, in coins or in bars, or trade it through vehicles such as Exchange Traded Funds, which track its price on international markets.
Silver prices can move due to a wide range of factors. Geopolitical instability or fears of a deep recession can make Silver price escalate due to its safe-haven status, although to a lesser extent than Gold's. As a yieldless asset, Silver tends to rise with lower interest rates. Its moves also depend on how the US Dollar (USD) behaves as the asset is priced in dollars (XAG/USD). A strong Dollar tends to keep the price of Silver at bay, whereas a weaker Dollar is likely to propel prices up. Other factors such as investment demand, mining supply – Silver is much more abundant than Gold – and recycling rates can also affect prices.
Silver is widely used in industry, particularly in sectors such as electronics or solar energy, as it has one of the highest electric conductivity of all metals – more than Copper and Gold. A surge in demand can increase prices, while a decline tends to lower them. Dynamics in the US, Chinese and Indian economies can also contribute to price swings: for the US and particularly China, their big industrial sectors use Silver in various processes; in India, consumers’ demand for the precious metal for jewellery also plays a key role in setting prices.
Silver prices tend to follow Gold's moves. When Gold prices rise, Silver typically follows suit, as their status as safe-haven assets is similar. The Gold/Silver ratio, which shows the number of ounces of Silver needed to equal the value of one ounce of Gold, may help to determine the relative valuation between both metals. Some investors may consider a high ratio as an indicator that Silver is undervalued, or Gold is overvalued. On the contrary, a low ratio might suggest that Gold is undervalued relative to Silver.
Author

Sagar Dua
FXStreet
Sagar Dua is associated with the financial markets from his college days. Along with pursuing post-graduation in Commerce in 2014, he started his markets training with chart analysis.


