Silver Price Forecast: XAG/USD remains close to multi-year top; bulls retain control near $48.30
- Silver attracts fresh buyers and remains close to a multi-year top touched earlier this week.
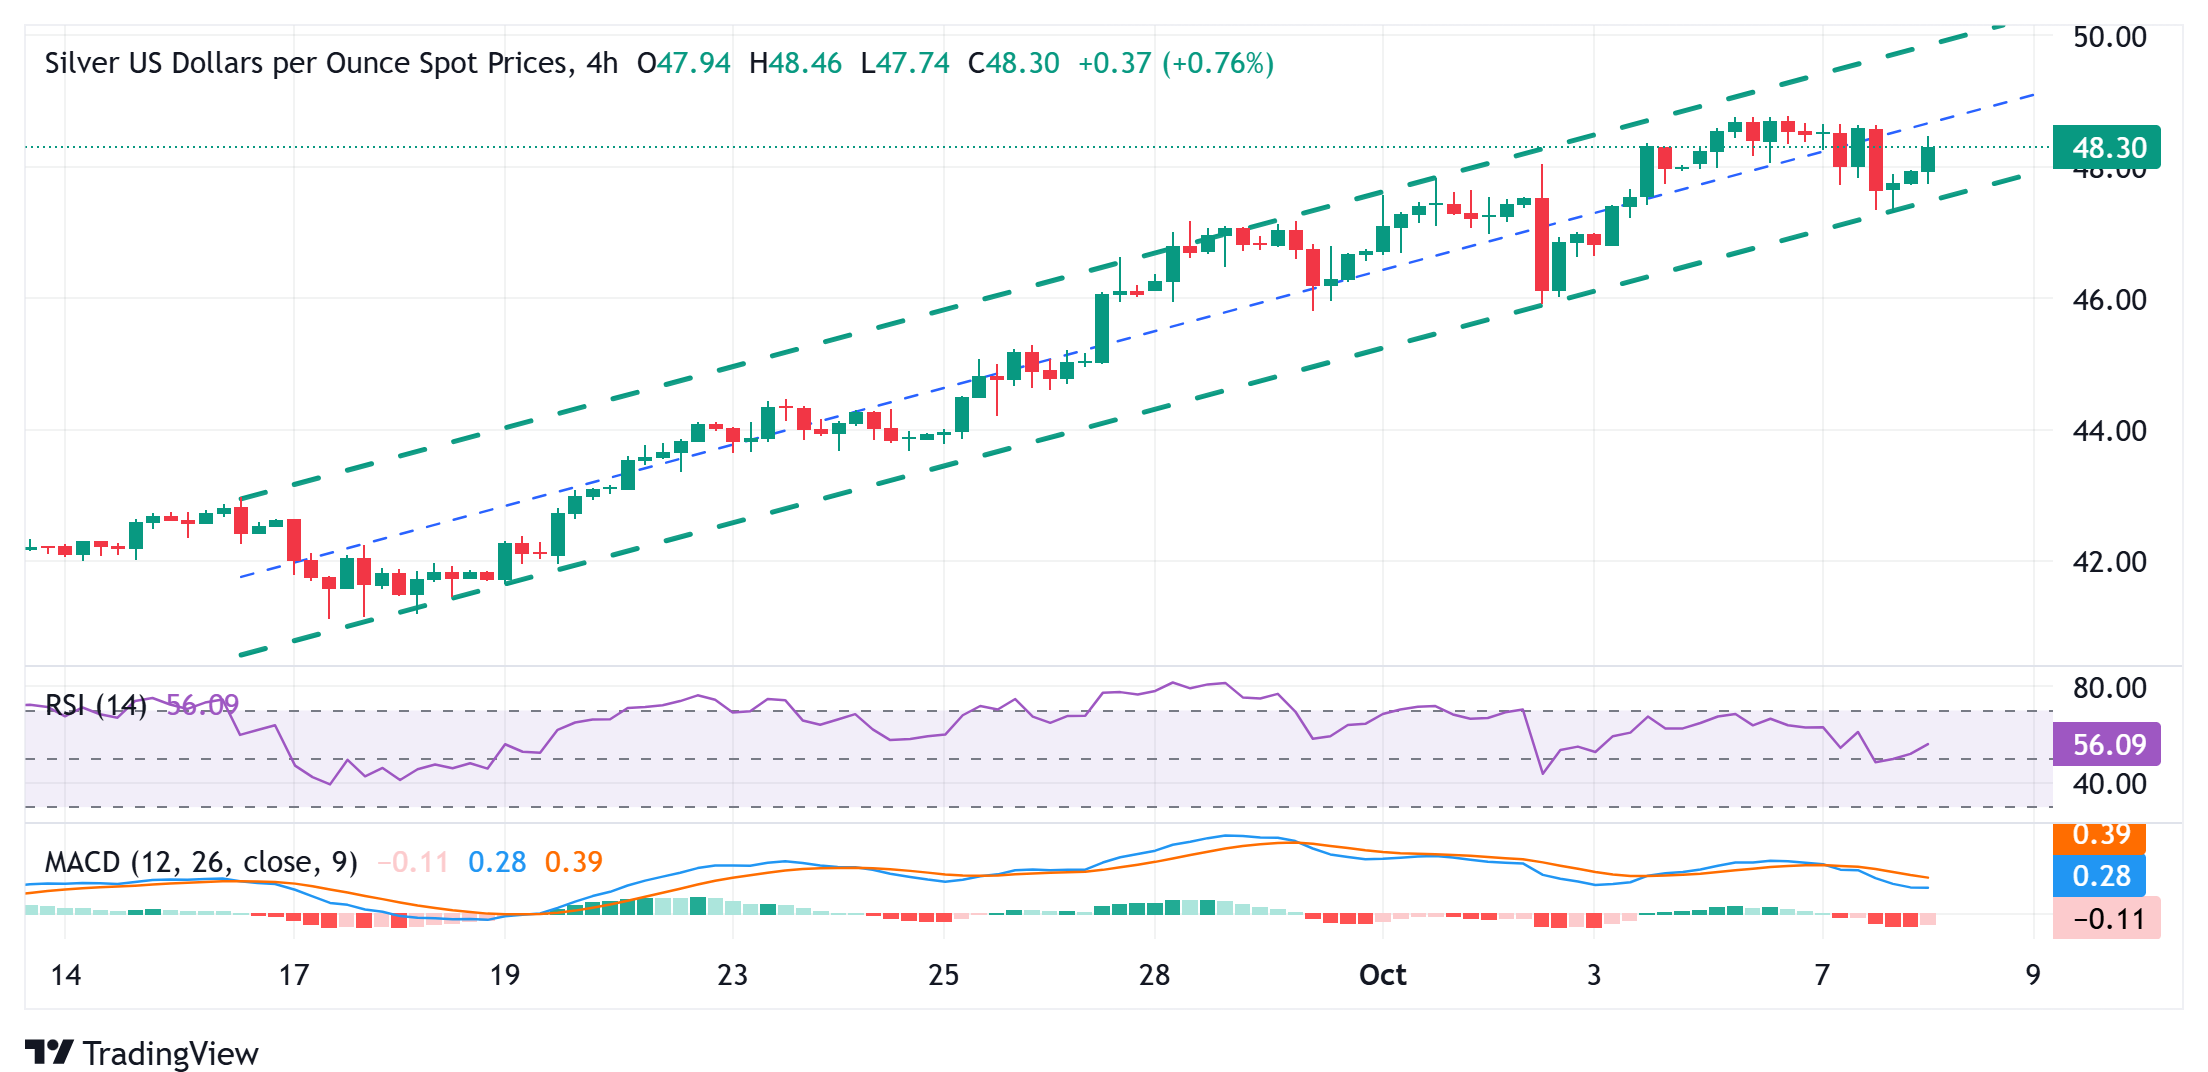
- The formation of an ascending channel points to a well-established short-term uptrend.
- The daily RSI is still flashing overbought conditions and warrants caution for bullish traders.

Silver (XAG/USD) regains positive traction following the previous day's modest pullback and climbs to the $48.30 region during the Asian session on Wednesday. Moreover, the white metal remains within striking distance of its highest level since April 2011, touched earlier this week, and seems poised to appreciate further.
The recent move up witnessed over the past two weeks or so, along an ascending channel, points to a well-established uptrend and validates the positive outlook. However, the daily Relative Strength Index (RSI) is holding above the 70 mark, pointing to still overbought conditions and warranting some caution for the XAG/USD bulls. Hence, it will be prudent to wait for some near-term consolidation or a modest pullback before positioning for any further appreciating move.
Nevertheless, the XAG/USD seems poised to climb further beyond the $48.75 region, or the multi-year peak, and aim towards reclaiming the $49.00 mark. The momentum could extend further towards the April 2011 swing high, around the $49.80 zone, before bulls aim to conquer the $50.00 psychological mark for the first time.
On the flip side, any corrective slide now seems to find decent support near the $48.00 round figure. This is closely followed by the Asian session trough, around the $47.75-$47.70 region, and the overnight low, around the $47.35-$47.30 zone. A convincing break below the latter would confirm a breakdown below the aforementioned trend channel and prompt some technical selling. The XAG/USD might then weaken further towards the $47.00 mark en route to the $46.65-$46.60 support.
Silver 4-hour chart
Silver FAQs
Silver is a precious metal highly traded among investors. It has been historically used as a store of value and a medium of exchange. Although less popular than Gold, traders may turn to Silver to diversify their investment portfolio, for its intrinsic value or as a potential hedge during high-inflation periods. Investors can buy physical Silver, in coins or in bars, or trade it through vehicles such as Exchange Traded Funds, which track its price on international markets.
Silver prices can move due to a wide range of factors. Geopolitical instability or fears of a deep recession can make Silver price escalate due to its safe-haven status, although to a lesser extent than Gold's. As a yieldless asset, Silver tends to rise with lower interest rates. Its moves also depend on how the US Dollar (USD) behaves as the asset is priced in dollars (XAG/USD). A strong Dollar tends to keep the price of Silver at bay, whereas a weaker Dollar is likely to propel prices up. Other factors such as investment demand, mining supply – Silver is much more abundant than Gold – and recycling rates can also affect prices.
Silver is widely used in industry, particularly in sectors such as electronics or solar energy, as it has one of the highest electric conductivity of all metals – more than Copper and Gold. A surge in demand can increase prices, while a decline tends to lower them. Dynamics in the US, Chinese and Indian economies can also contribute to price swings: for the US and particularly China, their big industrial sectors use Silver in various processes; in India, consumers’ demand for the precious metal for jewellery also plays a key role in setting prices.
Silver prices tend to follow Gold's moves. When Gold prices rise, Silver typically follows suit, as their status as safe-haven assets is similar. The Gold/Silver ratio, which shows the number of ounces of Silver needed to equal the value of one ounce of Gold, may help to determine the relative valuation between both metals. Some investors may consider a high ratio as an indicator that Silver is undervalued, or Gold is overvalued. On the contrary, a low ratio might suggest that Gold is undervalued relative to Silver.
Author

Haresh Menghani
FXStreet
Haresh Menghani is a detail-oriented professional with 10+ years of extensive experience in analysing the global financial markets.


