Silver Price Forecast: XAG/USD refreshes four-month high around $34 ahead of Fed’s policy decision
- Silver price rises sharply to near $34.00 as its appeal increases amid global economic uncertainty.
- The Fed is expected to leave interest rates steady on Wednesday.
- US President Trump is scheduled to speak with Russian leader Putin on a temporary ceasefire with Ukraine.

Silver price (XAG/USD) posts a fresh four-month high near $34.10 in European trading hours on Tuesday. The white metal strengthens as the US Dollar (USD) declines amid deepening uncertainty over the United States (US) economic outlook under the leadership of President Donald Trump.
The US Dollar Index (DXY), which tracks the Greenback’s value against six major currencies, slides to near the five-month low of 103.20.
US officials, including Donald Trump, have not ruled out an economic recession amid the implementation of new economic policies, especially tariffs. Market participants expect Trump’s tariff agenda could accelerate inflationary pressures and slow down economic growth globally. Historically, demand for non-yielding assets, such as Silver, increases amid heightened global economic woes and inflation.
Meanwhile, investors await US-Russia talks on a 30-day ceasefire plan on Tuesday. Last week, Ukraine agreed to a 30-day ceasefire plan after discussions with US officials in Saudi Arabia. On Monday, the European Union (EU) Foreign policy chief Kaja Kallas said the conditions demanded by Russia to agree to a ceasefire showed Moscow does not really want peace, Reuters report.
Signs of de-escalation in the Russia-Ukraine war would diminish the appeal of safe-haven assets. On the contrary, an absence of a positive outcome is unlikely to increase the strength of safe-haven bets as they already hold the risk premium of the three-year war in Ukraine.
Going forward, investors will pay close attention to the Federal Reserve’s (Fed) interest rate decision on Wednesday. The Fed is almost certain to keep interest rates steady in the range of 4.25%-4.50%. Investors will pay close attention to the Fed’s dot plot to know where officials see Federal Fund Rates heading in the near and long term.
Silver technical analysis
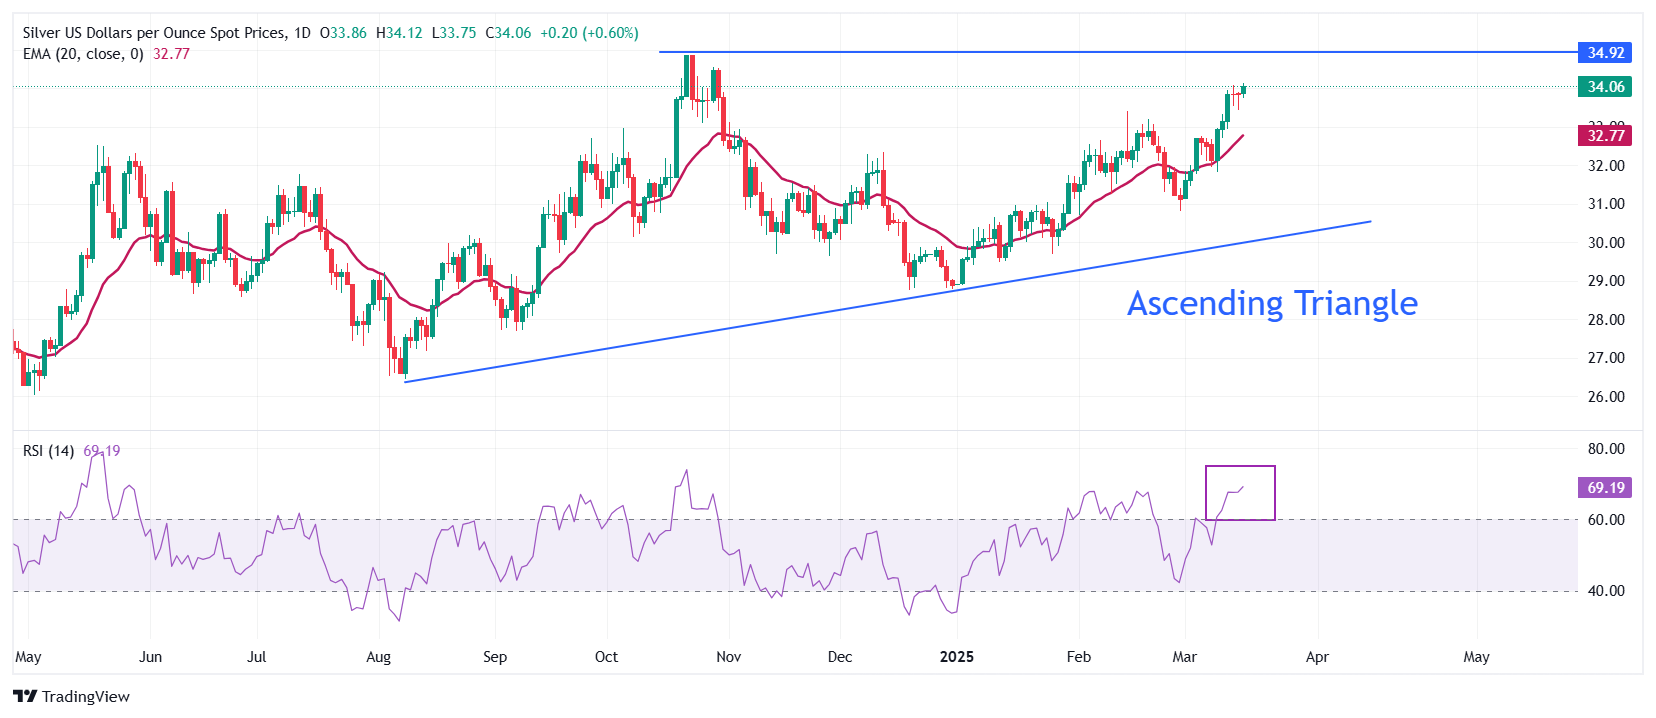
Silver price advances toward the flat border of the Ascending Triangle chart pattern formation on the daily timeframe near the October 22 high of $34.87. The upward-sloping border of the above-mentioned chart pattern is placed from the August 8 low of $26.45. Technically, the Ascending Triangle pattern indicates indecisiveness among market participants.
Advancing 20-day Exponential Moving Average (EMA) near $32.77 indicates a strong uptrend.
The 14-day Relative Strength Index (RSI) holds above 60.00, suggesting a strong bullish momentum.
Looking down, the March 6 high of $32.77 will act as key support for the Silver price. While, the October 22 high of $34.87 will be the major barrier.
Silver daily chart
Silver FAQs
Silver is a precious metal highly traded among investors. It has been historically used as a store of value and a medium of exchange. Although less popular than Gold, traders may turn to Silver to diversify their investment portfolio, for its intrinsic value or as a potential hedge during high-inflation periods. Investors can buy physical Silver, in coins or in bars, or trade it through vehicles such as Exchange Traded Funds, which track its price on international markets.
Silver prices can move due to a wide range of factors. Geopolitical instability or fears of a deep recession can make Silver price escalate due to its safe-haven status, although to a lesser extent than Gold's. As a yieldless asset, Silver tends to rise with lower interest rates. Its moves also depend on how the US Dollar (USD) behaves as the asset is priced in dollars (XAG/USD). A strong Dollar tends to keep the price of Silver at bay, whereas a weaker Dollar is likely to propel prices up. Other factors such as investment demand, mining supply – Silver is much more abundant than Gold – and recycling rates can also affect prices.
Silver is widely used in industry, particularly in sectors such as electronics or solar energy, as it has one of the highest electric conductivity of all metals – more than Copper and Gold. A surge in demand can increase prices, while a decline tends to lower them. Dynamics in the US, Chinese and Indian economies can also contribute to price swings: for the US and particularly China, their big industrial sectors use Silver in various processes; in India, consumers’ demand for the precious metal for jewellery also plays a key role in setting prices.
Silver prices tend to follow Gold's moves. When Gold prices rise, Silver typically follows suit, as their status as safe-haven assets is similar. The Gold/Silver ratio, which shows the number of ounces of Silver needed to equal the value of one ounce of Gold, may help to determine the relative valuation between both metals. Some investors may consider a high ratio as an indicator that Silver is undervalued, or Gold is overvalued. On the contrary, a low ratio might suggest that Gold is undervalued relative to Silver.
Author

Sagar Dua
FXStreet
Sagar Dua is associated with the financial markets from his college days. Along with pursuing post-graduation in Commerce in 2014, he started his markets training with chart analysis.


