Silver Price Forecast: XAG/USD posts fresh two-week low near $30, Fed policy in spotlight
- Silver price declines to near $30.20 amid firm bond yields ahead of Fed’s policy meeting on Wednesday.
- US bond yields remain firm on expectations that the Fed will signal fewer interest rate cuts for 2025.
- The US Dollar surrenders gains despite better-than-anticipated growth in the US Retail Sales data for November.

Silver price (XAG/USD) refreshes a two-week low near $30.20 in the North American session on Tuesday. The white metal faces selling pressure as bond yields extend its winning streak for the seventh trading day and climbs above 4.40%.
Higher yields on interest-bearing weigh on non-yielding assets, such as Silver, given that they result in elevated opportunity costs for them.
US Treasury yields have performed strongly ahead of the Federal Reserve’s (Fed) policy decision on Wednesday. The Fed is expected to cut interest rates by 25 basis points (bps) to 4.25%-4.50% but will choose “hawkish” guidance for the interest rate path for 2025.
Analysts at Macquarie said in a note that the “recent slowdown in the pace of US disinflation, a lower Unemployment Rate than what the Fed projected in September, and exuberance in US financial markets are contributing to this more hawkish stance.”
Meanwhile, the US Dollar Index (DXY), which gauges the Greenback’s value against six major currencies, gives up intraday gains and turns flat slightly below 107.00. The US Dollar (USD) surrenders gains even though the United States (US) monthly Retail Sales data for November beats estimates. The Retail Sales data, a key measure of consumer spending, rose by 0.7%, faster than estimates and the former release of 0.5%.
Silver technical analysis
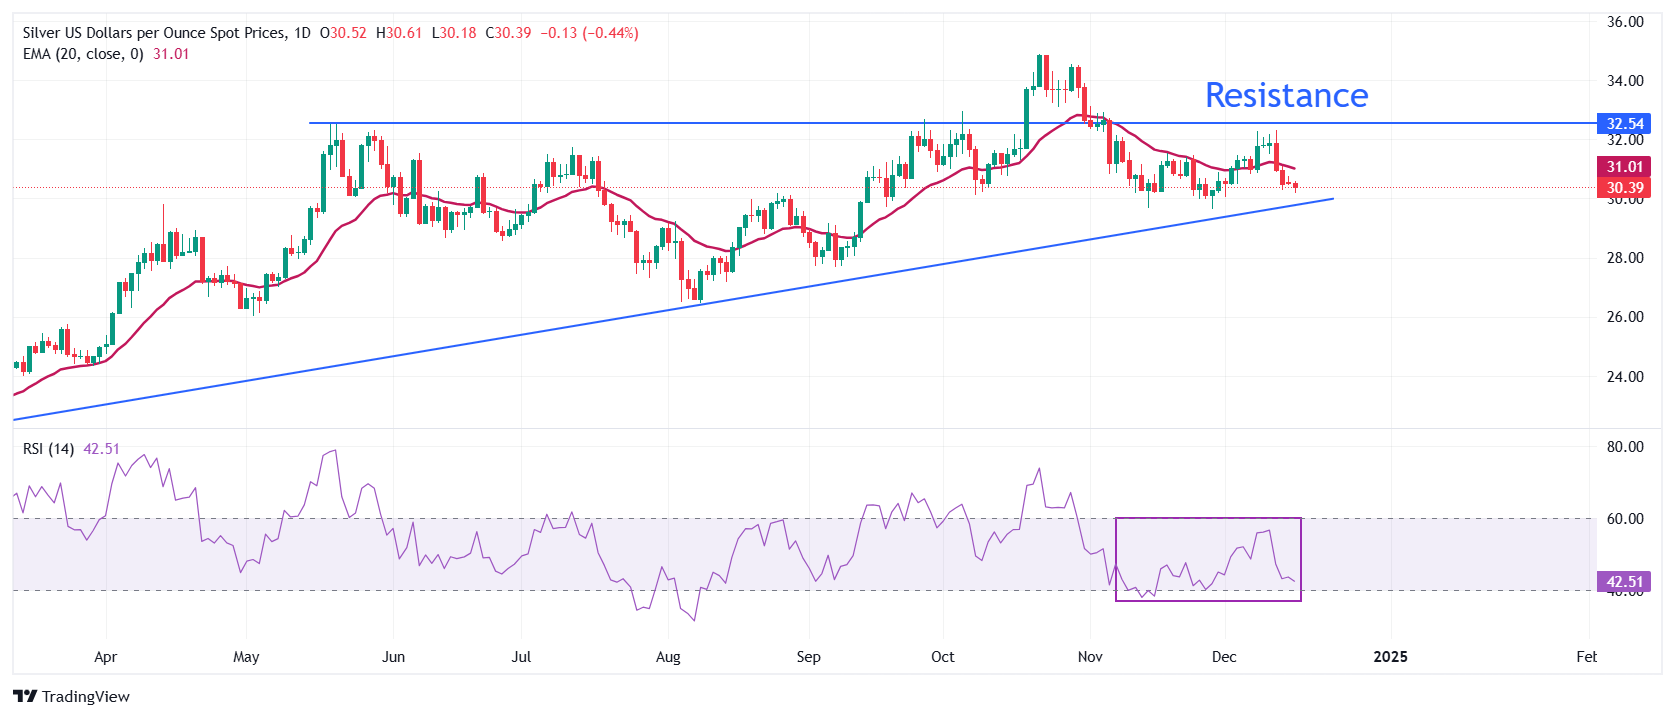
Silver price posts a fresh two-week low near $30.20 on Tuesday. The white metal weakens after breaking below the 20-day Exponential Moving Average (EMA), which trades around $31.00.
The 14-day Relative Strength Index (RSI) oscillates inside the 40.00-60.00 range, suggesting a sideways trend.
Looking down, the upward-sloping trendline around $29.50, plotted on a daily timeframe from the February 29 low of $22.30, would act as key support for the Silver price. On the upside, the horizontal resistance plotted from the May 21 high of $32.50 would be the barrier.
Silver daily chart
Silver FAQs
Silver is a precious metal highly traded among investors. It has been historically used as a store of value and a medium of exchange. Although less popular than Gold, traders may turn to Silver to diversify their investment portfolio, for its intrinsic value or as a potential hedge during high-inflation periods. Investors can buy physical Silver, in coins or in bars, or trade it through vehicles such as Exchange Traded Funds, which track its price on international markets.
Silver prices can move due to a wide range of factors. Geopolitical instability or fears of a deep recession can make Silver price escalate due to its safe-haven status, although to a lesser extent than Gold's. As a yieldless asset, Silver tends to rise with lower interest rates. Its moves also depend on how the US Dollar (USD) behaves as the asset is priced in dollars (XAG/USD). A strong Dollar tends to keep the price of Silver at bay, whereas a weaker Dollar is likely to propel prices up. Other factors such as investment demand, mining supply – Silver is much more abundant than Gold – and recycling rates can also affect prices.
Silver is widely used in industry, particularly in sectors such as electronics or solar energy, as it has one of the highest electric conductivity of all metals – more than Copper and Gold. A surge in demand can increase prices, while a decline tends to lower them. Dynamics in the US, Chinese and Indian economies can also contribute to price swings: for the US and particularly China, their big industrial sectors use Silver in various processes; in India, consumers’ demand for the precious metal for jewellery also plays a key role in setting prices.
Silver prices tend to follow Gold's moves. When Gold prices rise, Silver typically follows suit, as their status as safe-haven assets is similar. The Gold/Silver ratio, which shows the number of ounces of Silver needed to equal the value of one ounce of Gold, may help to determine the relative valuation between both metals. Some investors may consider a high ratio as an indicator that Silver is undervalued, or Gold is overvalued. On the contrary, a low ratio might suggest that Gold is undervalued relative to Silver.
Author

Sagar Dua
FXStreet
Sagar Dua is associated with the financial markets from his college days. Along with pursuing post-graduation in Commerce in 2014, he started his markets training with chart analysis.