|

Silver Price Forecast: XAG/USD posts fresh multi-year high at $30.50 on firm Fed rate-cut prospects

  • Silver price prints a fresh multi-year high at $30.50 amid firm speculation for Fed rate cuts.
  • The US Dollar falls back as investors see the Fed reducing interest rates from September.
  • Fed officials want to see more good inflation data to gain confidence that price pressures will return to the 2% target.

Silver price (XAG/USD) refreshes multi-year high at $30.50 in Friday’s New York session. The white metal strengthens on firm speculation that the Federal Reserve (Fed) will start reducing interest rates from the September meeting.

The confidence of investors for the Fed to begin lowering interest rates from September has strengthened as the United States Consumer Price Index (CPI) report for April has indicated that progress in the disinflation process has resumed after stalling in the January-March period. The scenario is favorable for non-yielding assets such as Silver but weighs on bond yields and the US Dollar.

The US Dollar Index (DXY), which tracks the Greenback’s value against six major currencies, retreats from the intraday high of 104.80.

In spite of an expected decline in the US inflation, Fed officials have maintained a hawkish guidance on interest rates. St. Louis Fed Bank President Loretta Mester said on Thursday inflation will take longer to reach the 2% target than what she previously thought." She emphasized the need to accumulate more data to have a clearer picture of the inflation outlook.

Silver technical analysis

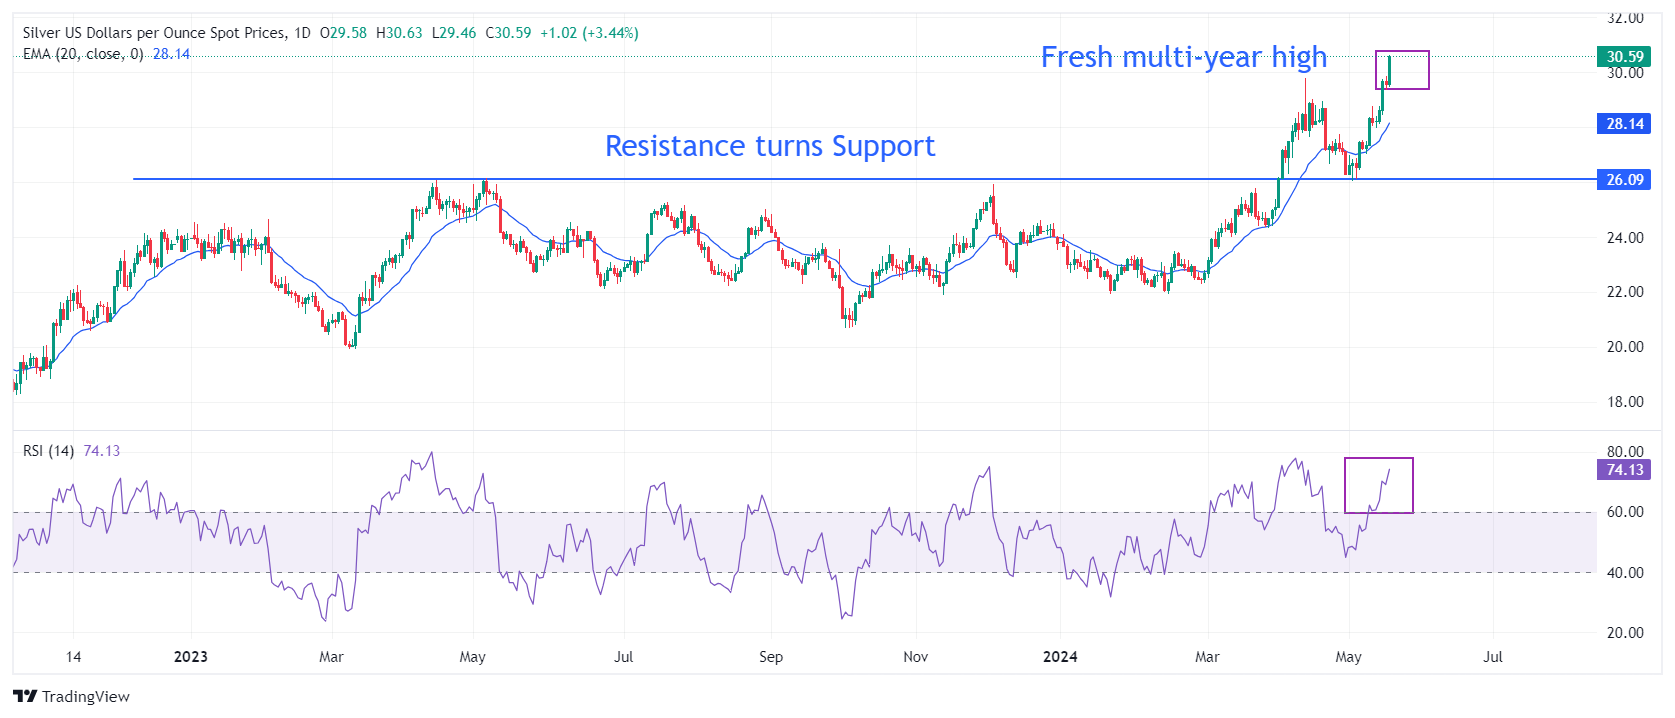
Silver price has posted a fresh multi-year high at $30.55. Earlier, Silver price recovers sharply after discovering buying interest near the horizontal support plotted from 14 April 2023 high around $26.09 on a daily timeframe. The above-mentioned support was earlier a major resistance for the Silver price bulls. The white metal is approaching the multi-year high at $29.80.

The near-term outlook of Silver has improved as it returns above the 20-period Exponential Moving Average (EMA), which trades around $28.10.

The 14-period Relative Strength Index (RSI) shifts into the bullish range of 60.00-80.00, suggesting that a bullish momentum has been triggered.

Silver daily chart

XAG/USD

Overview
Today last price30.58
Today Daily Change1.00
Today Daily Change %3.38
Today daily open29.58
 
Trends
Daily SMA2027.64
Daily SMA5026.71
Daily SMA10024.82
Daily SMA20024.04
 
Levels
Previous Daily High29.85
Previous Daily Low29.33
Previous Weekly High28.77
Previous Weekly Low26.44
Previous Monthly High29.8
Previous Monthly Low24.75
Daily Fibonacci 38.2%29.53
Daily Fibonacci 61.8%29.65
Daily Pivot Point S129.32
Daily Pivot Point S229.07
Daily Pivot Point S328.81
Daily Pivot Point R129.84
Daily Pivot Point R230.1
Daily Pivot Point R330.35

Author

Sagar Dua

Sagar Dua

FXStreet

Sagar Dua is associated with the financial markets from his college days. Along with pursuing post-graduation in Commerce in 2014, he started his markets training with chart analysis.

More from Sagar Dua
Share:

Markets move fast. We move first.

Orange Juice Newsletter brings you expert driven insights - not headlines. Every day on your inbox.

By subscribing you agree to our Terms and conditions.

Editor's Picks

EUR/USD softens below 1.1750 amid ECB rate hold expectations

The EUR/USD pair declines to around 1.1730 during the early European session on Wednesday, pressured by renewed US Dollar demand. Nonetheless, the potential downside for the major pair might be limited amid the growing acceptance that the European Central Bank is done cutting interest rates. 

When is the UK CPI inflation data and how could it affect GBP/USD?

The United Kingdom Office for National Statistics will publish the highly relevant Consumer Price Index (CPI) data for November on Wednesday at 07:00 GMT. GBP/USD is likely to stay subdued if UK CPI meets expectations. However, any upside surprise could cap losses by tempering dovish sentiment ahead of the Bank of England’s policy decision on Thursday. 

Gold: Bulls await breakout through multi-day-old range amid Fed rate cut bets

Gold attracts fresh buyers during the Asian session on Wednesday, though it remains confined in a multi-day-old trading range amid mixed fundamental cues. The global risk sentiment remains on the defensive amid economic woes and fears of the AI bubble burst. Moreover, dovish US Federal Reserve expectations lend support to the non-yielding yellow metal, though a modest US Dollar uptick might cap any further appreciating move.

Bitcoin, Ethereum and Ripple extend correction as bearish momentum builds

Bitcoin, Ethereum, and Ripple remain under pressure as the broader market continues its corrective phase into midweek. The weak price action of these top three cryptocurrencies by market capitalization suggests a deeper correction, as momentum indicators are beginning to tilt bearish.

Ukraine-Russia in the spotlight once again

Since the start of the week, gold’s price has moved lower, but has yet to erase the gains made last week. In today’s report we intend to focus on the newest round of peace talks between Russia and Ukraine, whilst noting the release of the US Employment data later on day and end our report with an update in regards to the tensions brewing in Venezuela.

BNB Price Forecast: BNB slips below $855 as bearish on-chain signals and momentum indicators turn negative

BNB, formerly known as Binance Coin, continues to trade down around $855 at the time of writing on Tuesday, after a slight decline the previous day. Bearish sentiment further strengthens as BNB’s on-chain and derivatives data show rising retail activity.