Silver Price Forecast: XAG/USD is testing the top of a potential Bullish Flag at $36.60

Silver consolidates above $36.00 with the upside trend intact.
Risk-off markets and higher demand for safe havens are supportive of precious metals.
XAG/USD is forming a potential Bullish Flag.
Silver (XAG/USD) is on a downside correction from all-time highs, near $37.00 hit on Early June. Price action is moving within a descending channel, which could turn into a bullish flag if the trendline resistance, now at $36.60, gives way.
The fundamental context is supportive. Investors are looking for safety as the war between Israel and Iran escalates. Trump has left the G7 meeting ahead of schedule and urged the National Security Council to be prepared on his arrival in Washington in a move that has boosted concerns that the US might be involved in the war.
Market movements, however, remain limited, with investors looking from the sidelines ahead of a string of central bank decisions, including the Federal Reserve, due later this week.
XAG/USD bulls are focusing on the $37.00 resistance area
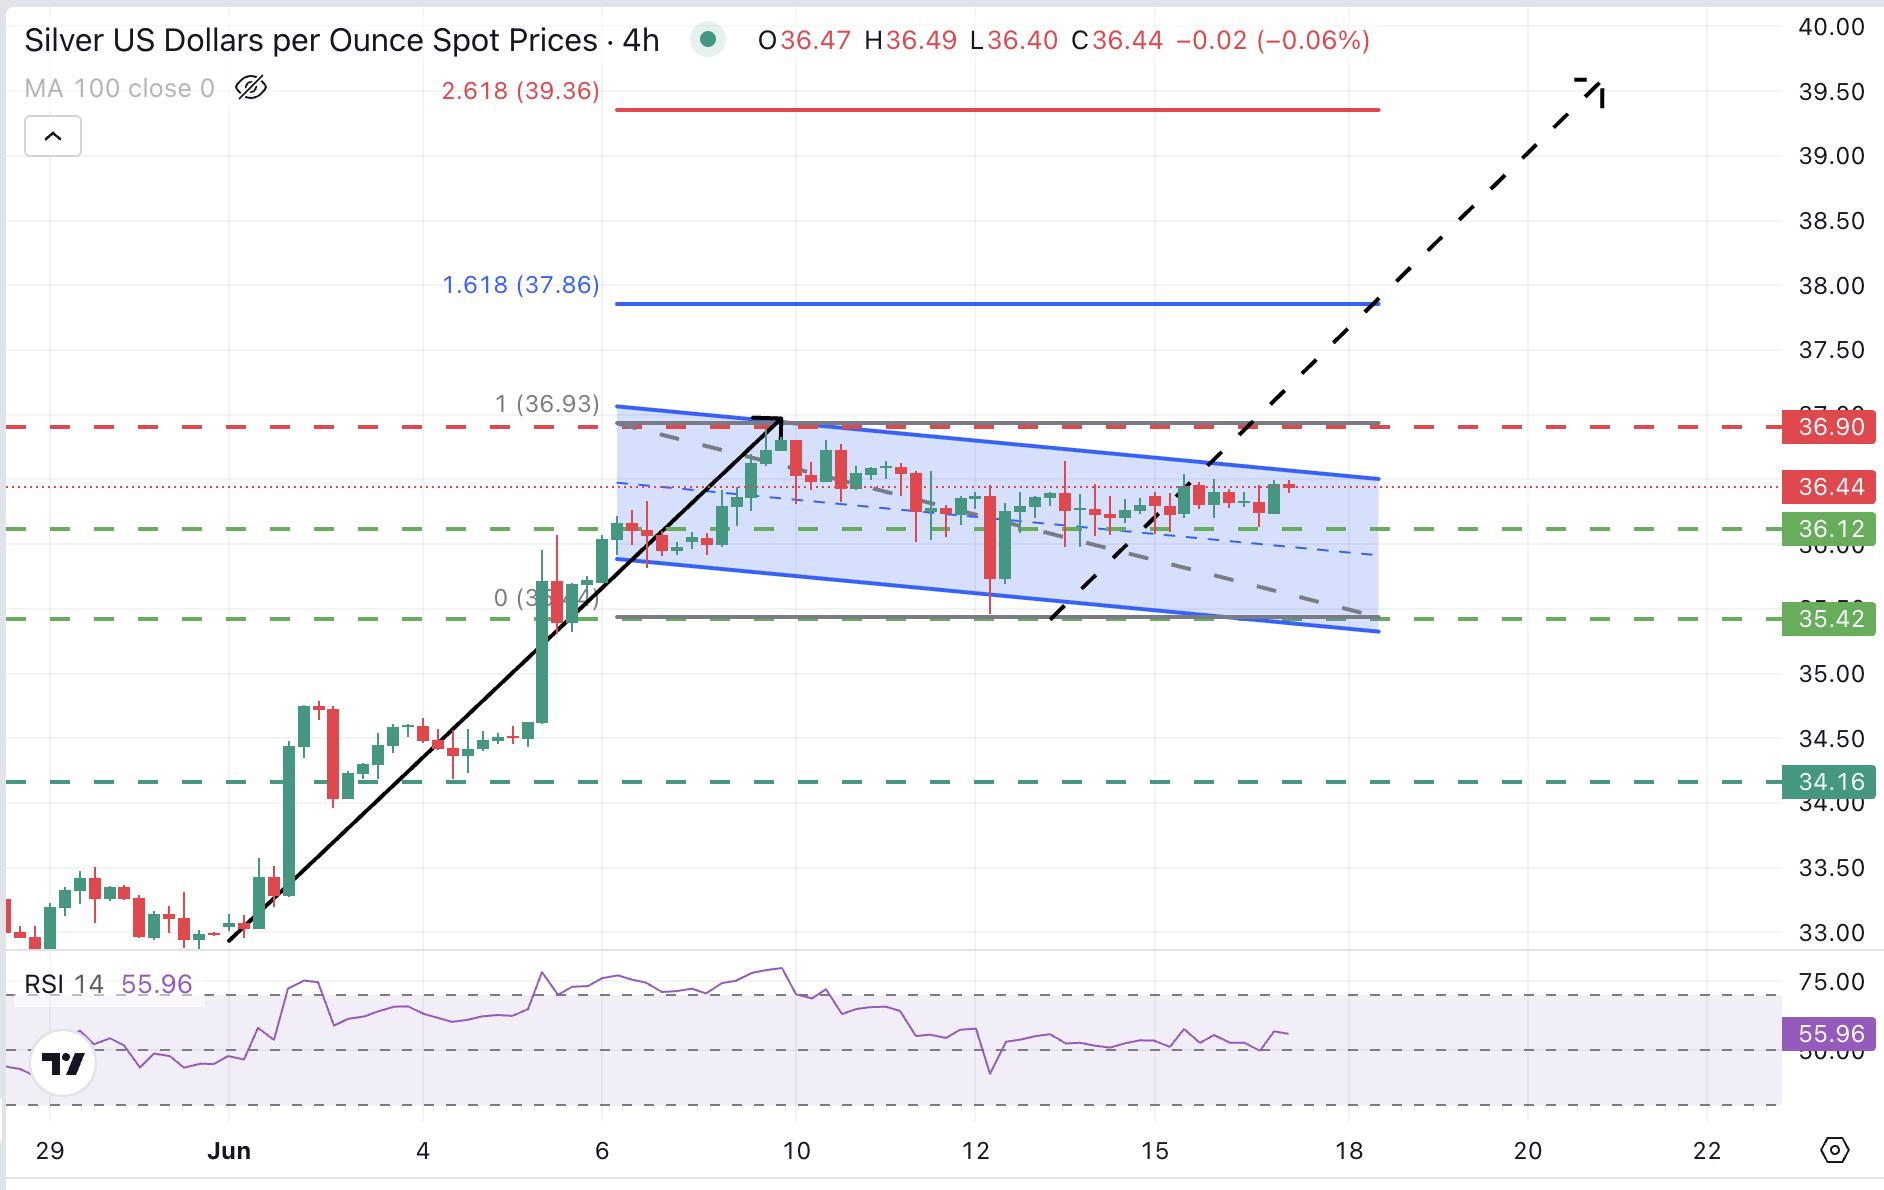
Technical studies suggest a potential bullish flag in progress, with its top at the mentioned $36.60 level, which is being tested at the moment of writing ahead of the $37,00 all-time high reached on June 9.
Above here, the 161.8% Fibonacci extension of the June 9 to June 11 bearish correction is at $37.85. The 261.8% extension of the mentioned range is at $39.35, right below the measured target of the bullish flag, at 39.55.
On the downside, immediate support is at the $36.10 level (June 11 and 13 lows) above $35.40 (June 12 low). A bearish reaction below here would cancel this view and bring the June 4 low, at $34.20, back into play.
XAG/USD 4-Hour Chart
Silver FAQs
Silver is a precious metal highly traded among investors. It has been historically used as a store of value and a medium of exchange. Although less popular than Gold, traders may turn to Silver to diversify their investment portfolio, for its intrinsic value or as a potential hedge during high-inflation periods. Investors can buy physical Silver, in coins or in bars, or trade it through vehicles such as Exchange Traded Funds, which track its price on international markets.
Silver prices can move due to a wide range of factors. Geopolitical instability or fears of a deep recession can make Silver price escalate due to its safe-haven status, although to a lesser extent than Gold's. As a yieldless asset, Silver tends to rise with lower interest rates. Its moves also depend on how the US Dollar (USD) behaves as the asset is priced in dollars (XAG/USD). A strong Dollar tends to keep the price of Silver at bay, whereas a weaker Dollar is likely to propel prices up. Other factors such as investment demand, mining supply – Silver is much more abundant than Gold – and recycling rates can also affect prices.
Silver is widely used in industry, particularly in sectors such as electronics or solar energy, as it has one of the highest electric conductivity of all metals – more than Copper and Gold. A surge in demand can increase prices, while a decline tends to lower them. Dynamics in the US, Chinese and Indian economies can also contribute to price swings: for the US and particularly China, their big industrial sectors use Silver in various processes; in India, consumers’ demand for the precious metal for jewellery also plays a key role in setting prices.
Silver prices tend to follow Gold's moves. When Gold prices rise, Silver typically follows suit, as their status as safe-haven assets is similar. The Gold/Silver ratio, which shows the number of ounces of Silver needed to equal the value of one ounce of Gold, may help to determine the relative valuation between both metals. Some investors may consider a high ratio as an indicator that Silver is undervalued, or Gold is overvalued. On the contrary, a low ratio might suggest that Gold is undervalued relative to Silver.
Author

Guillermo Alcala
FXStreet
Graduated in Communication Sciences at the Universidad del Pais Vasco and Universiteit van Amsterdam, Guillermo has been working as financial news editor and copywriter in diverse Forex-related firms, like FXStreet and Kantox.


