- Silver price exhibits strength around $28 despite traders pare Fed rate cut bets for June.
- Fed Bowman said current conditions are not appropriate for lowering borrowing rates.
- The US Dollar awaits the US inflation data for fresh guidance.
Silver price (XAG/USD) faces a nominal sell-off after printing a fresh two-year high around $28.00 in Monday’s early New York session. The near-term demand for the white metal remains strong even though US Treasury yields soar after upbeat United States Nonfarm Payrolls (NFP) data for March dent speculation for the Federal Reserve (Fed) lowering borrowing rates from the June meeting. 10-year US Treasury yields rise to 4.43%.
Strong labor demand is offset by higher wage offerings, which leads to robust consumer spending that fuels consumer price inflation. After the US NFP release, Fed Governor Michelle Bowman said, “We are still not yet at the point where it is appropriate to lower the policy rate, and I continue to see a number of upside risks to inflation.”
Fed policymakers have been reiterating that there is no urgency for rate cuts. Policymakers need good inflation data for months before pivoting to rate cuts.
The US Dollar Index (DXY) falls slightly to 104.24 but remains inside Friday’s trading range. The USD index stays on the sidelines as the focus shifts to the consumer price inflation data for March, which will be published on Wednesday.
The core CPI that strips off volatile food and Oil prices is estimated to have dipped slightly to 3.7% from 3.8%. A more-than-anticipated decline in the US inflation data will prompt Fed rate cut expectations for the June meeting.
Silver technical analysis
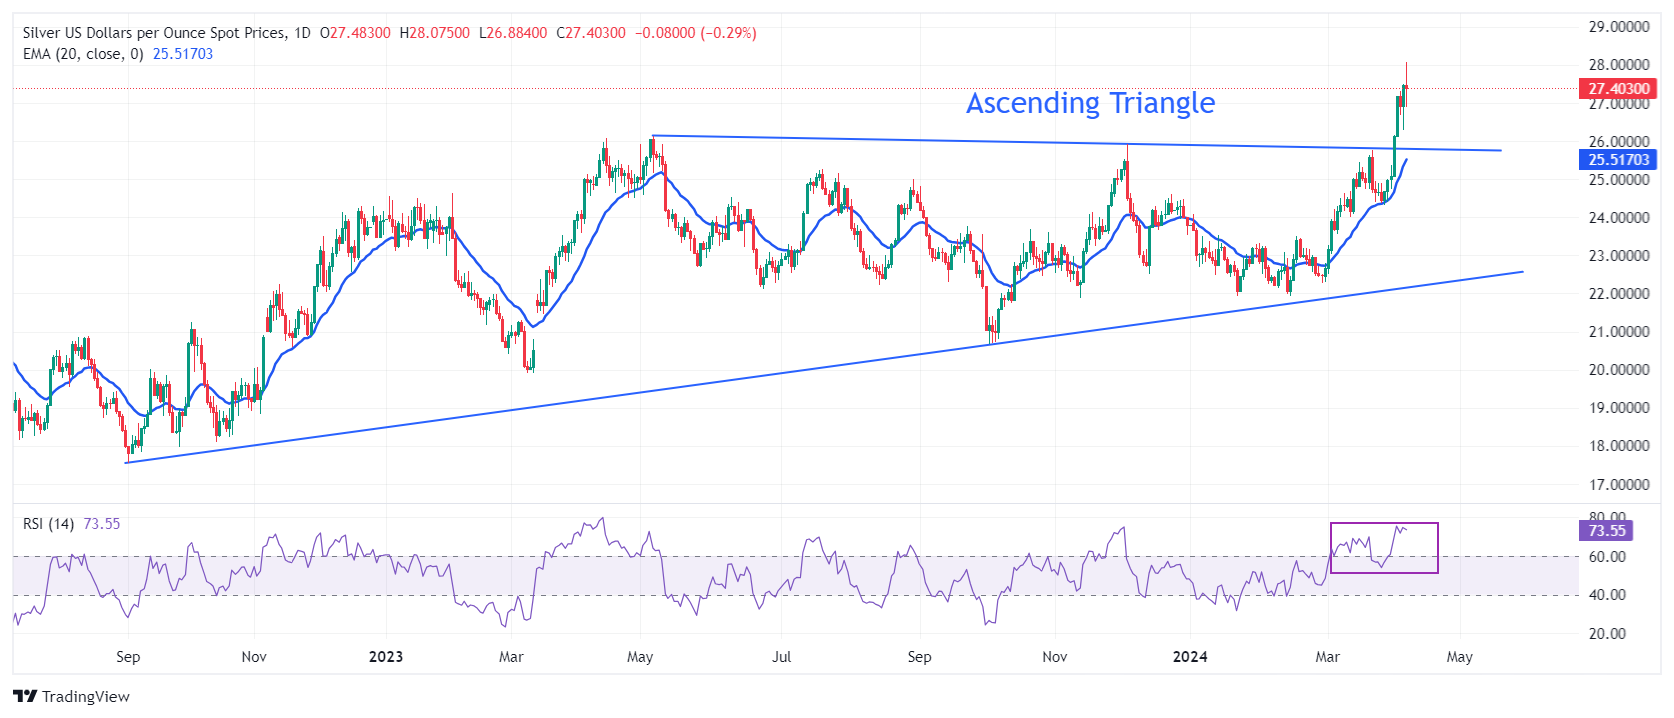
Silver price sees a sharp upside after a breakout of the Ascending Triangle pattern formed on daily timeframe. The aforementioned chart pattern exhibits sharp volatility contraction but a decisive breakout leads to heavy volume and wider ticks on the upside. The horizontal resistance of the above-mentioned chart pattern, placed from May 5 high at $26.13, has turned into a crucial support for the Silver price bulls.
Advancing 20-day Exponential Moving Average (EMA) near $25.50 keeps the near-term demand strong.
The 14-period Relative Strength Index (RSI) oscillates in the bullish range of 60.00-80.00, indicating a strong momentum leaned to the upside.
Silver daily chart
Information on these pages contains forward-looking statements that involve risks and uncertainties. Markets and instruments profiled on this page are for informational purposes only and should not in any way come across as a recommendation to buy or sell in these assets. You should do your own thorough research before making any investment decisions. FXStreet does not in any way guarantee that this information is free from mistakes, errors, or material misstatements. It also does not guarantee that this information is of a timely nature. Investing in Open Markets involves a great deal of risk, including the loss of all or a portion of your investment, as well as emotional distress. All risks, losses and costs associated with investing, including total loss of principal, are your responsibility. The views and opinions expressed in this article are those of the authors and do not necessarily reflect the official policy or position of FXStreet nor its advertisers. The author will not be held responsible for information that is found at the end of links posted on this page.
If not otherwise explicitly mentioned in the body of the article, at the time of writing, the author has no position in any stock mentioned in this article and no business relationship with any company mentioned. The author has not received compensation for writing this article, other than from FXStreet.
FXStreet and the author do not provide personalized recommendations. The author makes no representations as to the accuracy, completeness, or suitability of this information. FXStreet and the author will not be liable for any errors, omissions or any losses, injuries or damages arising from this information and its display or use. Errors and omissions excepted.
The author and FXStreet are not registered investment advisors and nothing in this article is intended to be investment advice.
Recommended content
Editors’ Picks
AUD/USD regains the constructive outlook above the 200-day SMA
AUD/USD advanced strongly for the second session in a row, this time extending the recovery to the upper 0.6500s and shifting its focus to the weekly highs in the 0.6580-0.6585 band, an area coincident with the 100-day SMA.
EUR/USD keeps the bullish performance above 1.0700
The continuation of the sell-off in the Greenback in the wake of the FOMC gathering helped EUR/USD extend its bounce off Wednesday’s lows near 1.0650, advancing past the 1.0700 hurdle ahead of the crucial release of US NFP on Friday.
Gold stuck around $2,300 as market players lack directional conviction
Gold extended its daily slide and dropped below $2,290 in the second half of the day on Thursday. The benchmark 10-year US Treasury bond yield erased its daily losses after US data, causing XAU/USD to stretch lower ahead of Friday's US jobs data.
Bitcoin price rises 5% as BlackRock anticipates a new wave of capital inflows into BTC ETFs from investors
Bitcoin (BTC) price slid to the depths of $56,552 on Wednesday as the cryptocurrency market tried to front run the Federal Open Market Committee (FOMC) meeting. The flash crash saw millions in positions get liquidated.
FOMC in the rear-view mirror – NFP eyed
The update from May’s FOMC rate announcement proved more dovish than expected, which naturally weighed on the US dollar (sending the DXY to lows of 105.44) and US yields, as well as, initially at least, underpinning major US equity indices.