Silver Price Forecast: XAG/USD extends bull run to near $72.70 as Fed dovish bets remain steady
- Silver price extends rally to near $72.70 amid firm Fed dovish expectations for 2026.
- The Fed is expected to cut interest rates by at least 50 bps next year.
- The US Q3 GDP unexpectedly grew by 4.3%, faster than the prior reading of 3.8%.
Silver price (XAG/USD) rallies further to near $72.70 during the early European trading session on Wednesday. The white metal extends its bull run as Federal Reserve (Fed) dovish expectations for 2026 remain broadly firm, even as the United States (US) Q3 Gross Domestic Product (GDP) came in surprisingly higher.
According to the CME FedWatch tool, traders see a 70.6% that the Fed will reduce interest rates by at least 50 bps in 2026, signaling a higher scope of interest rate cuts than the Fed’s projections in its dot plot last week. The Fed’s dot plot showed that policymakers collectively see the Federal Funds Rate heading to 3.4% by the end of 2026, indicating that there won’t be more than one interest rate cut.
Theoretically, lower interest rates by the Fed bode well for non-yielding assets, such as Silver.
On Tuesday, the US GDP data showed that the economy grew at a robust pace of 4.3% year-on-year (YoY). Economists expect the US GDP growth to come in lower at 3.3% from 3.8% recorded in the second quarter of the year.
In Wednesday’s session, investors will focus on Initial Jobless Claims data, which will be published at 13:30 GMT. Individuals claiming jobless benefits for the first time are expected to have remained steady at 223K.
Silver technical analysis
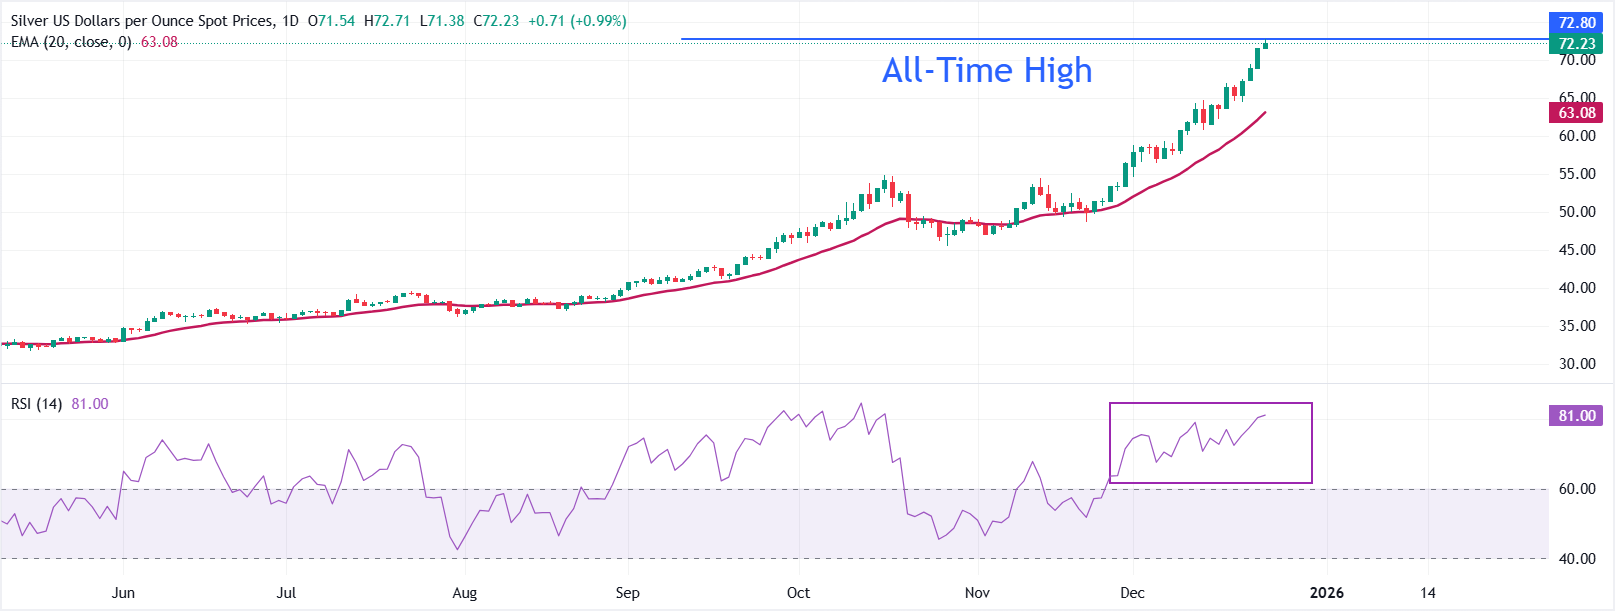
In the daily chart, XAG/USD trades at $72.19. The 20-day exponential moving average is ascending, and price holds well above it, reinforcing a firm bullish bias. The average’s positive slope continues to support the advance. RSI (14) at 80.95 is overbought, signaling stretched momentum that could precede consolidation.
Should momentum cool, pullbacks could find support at the 20-day EMA around $63.07. The uptrend would remain intact while above this dynamic floor, whereas a loss of that level would expose a deeper retracement as overbought conditions unwind.
(The technical analysis of this story was written with the help of an AI tool.)
Silver FAQs
Silver is a precious metal highly traded among investors. It has been historically used as a store of value and a medium of exchange. Although less popular than Gold, traders may turn to Silver to diversify their investment portfolio, for its intrinsic value or as a potential hedge during high-inflation periods. Investors can buy physical Silver, in coins or in bars, or trade it through vehicles such as Exchange Traded Funds, which track its price on international markets.
Silver prices can move due to a wide range of factors. Geopolitical instability or fears of a deep recession can make Silver price escalate due to its safe-haven status, although to a lesser extent than Gold's. As a yieldless asset, Silver tends to rise with lower interest rates. Its moves also depend on how the US Dollar (USD) behaves as the asset is priced in dollars (XAG/USD). A strong Dollar tends to keep the price of Silver at bay, whereas a weaker Dollar is likely to propel prices up. Other factors such as investment demand, mining supply – Silver is much more abundant than Gold – and recycling rates can also affect prices.
Silver is widely used in industry, particularly in sectors such as electronics or solar energy, as it has one of the highest electric conductivity of all metals – more than Copper and Gold. A surge in demand can increase prices, while a decline tends to lower them. Dynamics in the US, Chinese and Indian economies can also contribute to price swings: for the US and particularly China, their big industrial sectors use Silver in various processes; in India, consumers’ demand for the precious metal for jewellery also plays a key role in setting prices.
Silver prices tend to follow Gold's moves. When Gold prices rise, Silver typically follows suit, as their status as safe-haven assets is similar. The Gold/Silver ratio, which shows the number of ounces of Silver needed to equal the value of one ounce of Gold, may help to determine the relative valuation between both metals. Some investors may consider a high ratio as an indicator that Silver is undervalued, or Gold is overvalued. On the contrary, a low ratio might suggest that Gold is undervalued relative to Silver.
Author

Sagar Dua
FXStreet
Sagar Dua is associated with the financial markets from his college days. Along with pursuing post-graduation in Commerce in 2014, he started his markets training with chart analysis.


