Silver Price Forecast: XAG/USD eases from multi-week top, flat lines around mid-$38.00s
- Silver struggles to build on modest Asian session gains to a multi-week top.
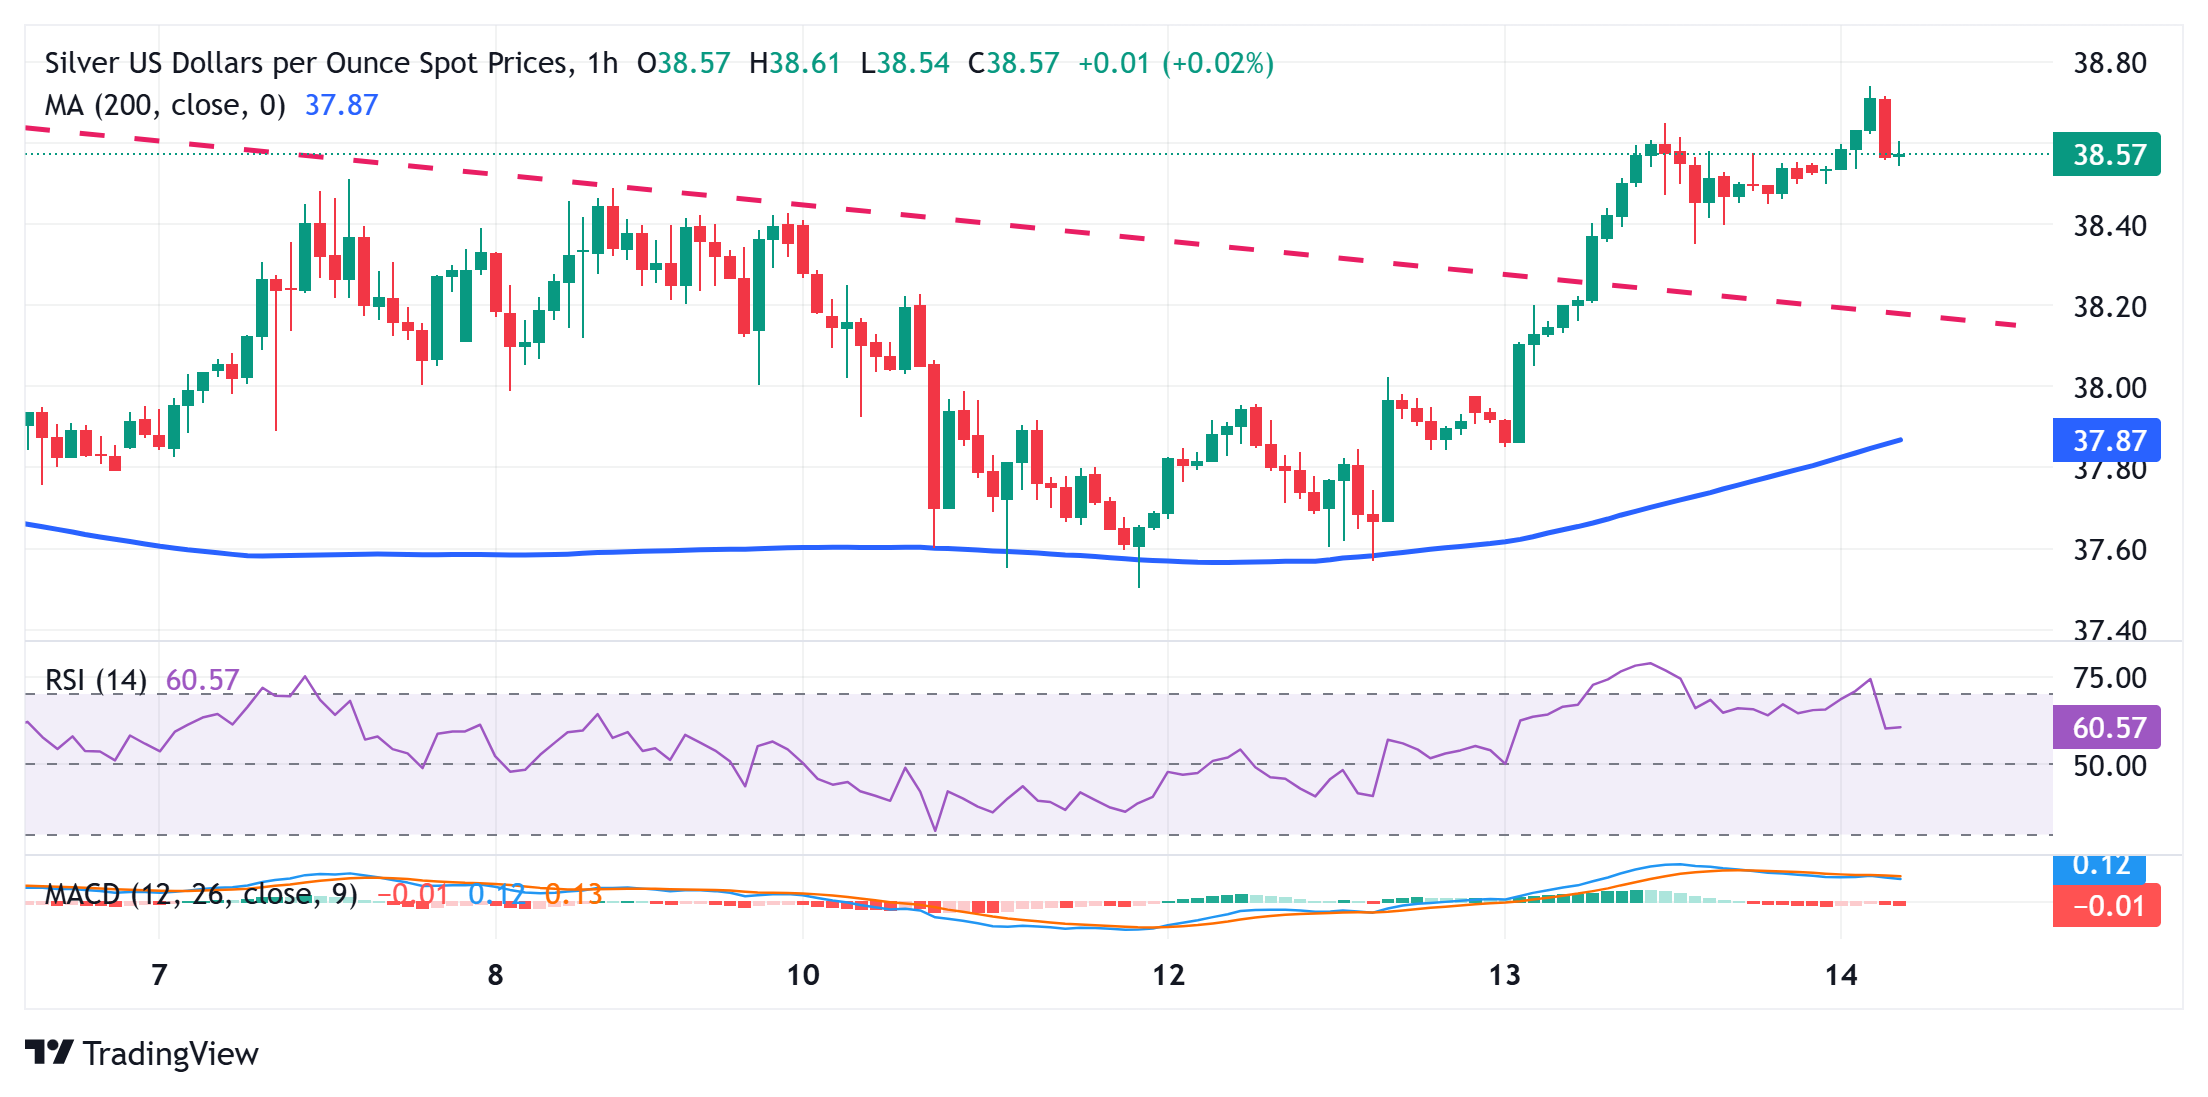
- A slightly overbought RSI on the 1-hour chart prompts some profit-taking.
- The constructive setup backs the case for the emergence of dip-buying.

Silver (XAG/USD) retreats slightly from a nearly three-week top touched during the Asian session on Thursday and is currently trading just above mid-$38.00s, up around 0.10% for the day. The US Dollar (USD) stages a modest recovery from its lowest level in over two weeks and turns out to be a key factor acting as a headwind for the USD-denominated commodity.
From a technical perspective, the pullback could be attributed to some profit-taking amid a slightly overbought Relative Strength Index (RSI) on the 1-hour chart. That said, Wednesday's breakout through a short-term descending trend-line resistance and a subsequent strength beyond the $38.40 horizontal barrier was seen as a key trigger for the XAG/USD bulls. Moreover, positive oscillators on the daily chart suggest that any meaningful corrective slide could be seen as a buying opportunity.
Hence, weakness below the $38.40 resistance-turned-support is more likely to be limited near the trend-line hurdle breakpoint, around the $38.10 region. Some follow-through selling and acceptance below the $38.00 mark, however, has the potential to drag the XAG/USD further towards mid-$37.00s en route to the $37.00 neighborhood. A convincing break below the latter might shift the bias in favor of bearish traders and set the stage for a further near-term depreciating move.
On the flip side, bulls might now wait for a move beyond the multi-week top, around the $38.75 region, before placing fresh bets. The XAG/USD might then aim to reclaim the $39.00 round-figure mark and then extend the positive momentum further towards challenging the $39.50 area, or the highest since February 2012, set last month.
Silver 1-hou chart
Silver FAQs
Silver is a precious metal highly traded among investors. It has been historically used as a store of value and a medium of exchange. Although less popular than Gold, traders may turn to Silver to diversify their investment portfolio, for its intrinsic value or as a potential hedge during high-inflation periods. Investors can buy physical Silver, in coins or in bars, or trade it through vehicles such as Exchange Traded Funds, which track its price on international markets.
Silver prices can move due to a wide range of factors. Geopolitical instability or fears of a deep recession can make Silver price escalate due to its safe-haven status, although to a lesser extent than Gold's. As a yieldless asset, Silver tends to rise with lower interest rates. Its moves also depend on how the US Dollar (USD) behaves as the asset is priced in dollars (XAG/USD). A strong Dollar tends to keep the price of Silver at bay, whereas a weaker Dollar is likely to propel prices up. Other factors such as investment demand, mining supply – Silver is much more abundant than Gold – and recycling rates can also affect prices.
Silver is widely used in industry, particularly in sectors such as electronics or solar energy, as it has one of the highest electric conductivity of all metals – more than Copper and Gold. A surge in demand can increase prices, while a decline tends to lower them. Dynamics in the US, Chinese and Indian economies can also contribute to price swings: for the US and particularly China, their big industrial sectors use Silver in various processes; in India, consumers’ demand for the precious metal for jewellery also plays a key role in setting prices.
Silver prices tend to follow Gold's moves. When Gold prices rise, Silver typically follows suit, as their status as safe-haven assets is similar. The Gold/Silver ratio, which shows the number of ounces of Silver needed to equal the value of one ounce of Gold, may help to determine the relative valuation between both metals. Some investors may consider a high ratio as an indicator that Silver is undervalued, or Gold is overvalued. On the contrary, a low ratio might suggest that Gold is undervalued relative to Silver.
Author

Haresh Menghani
FXStreet
Haresh Menghani is a detail-oriented professional with 10+ years of extensive experience in analysing the global financial markets.


