Silver Price Forecast: XAG/USD drops to near $36.50 despite escalating global trade jitters
- Silver price trades lower to near $36.50 as higher US Dollar has capped its upside.
- US President Trump is expected to release fresh batch of tariff rates for over seven trading partners.
- The White House plans to impose 50% tariffs on Copper imports.

Silver price (XAG/USD) falls to near $36.50 during Asian trading hours on Wednesday. The white metal faces a slight selling pressure even as the White House has signaled that it will release more letters, specifying additional import rates, to those nations that have not closed a trade deal during the 90-day tariff pause.
United States (US) Commerce Secretary Howard Lutnick said in an interview with CNBC on Tuesday that more than 15 countries will receive letters in a couple of days. “I expect 15-20 trade letters to go out over the next 2 days,” Lutnick said.
On Tuesday, US President Donald Trump also stated through a post on Truth.Social he will announce new tariff rates for minimum of seven countries on Wednesday’s morning and more in afternoon. “We will be releasing a minimum of 7 Countries having to do with trade, tomorrow morning, with an additional number of Countries being released in the afternoon. Thank you for your attention to this matter!” Trump wrote.
The announcement of new tariff rates by the US for its trading partners will intensify trade war globally. Over the weekend, Trump also announced new tariff rates for 14 nations, in which notable mentions were Japan and South Korea.
Theoretically, escalating global trade tensions improve demand for safe-haven assets, such as Silver. However, it struggles to attract bids as the US Dollar (USD) trades firmly. The US Dollar Index (DXY), which tracks the Greenback’s value against six major currencies, trades close to weekly high around 97.80 posted on Tuesday.
Technically, higher US Dollar makes the Silver price an expensive bet for investors.
Additionally, US President Trump has also threatened to impose 50% tariffs on Copper imports and 200% additional import duty on pharmaceuticals next year.
Silver technical analysis
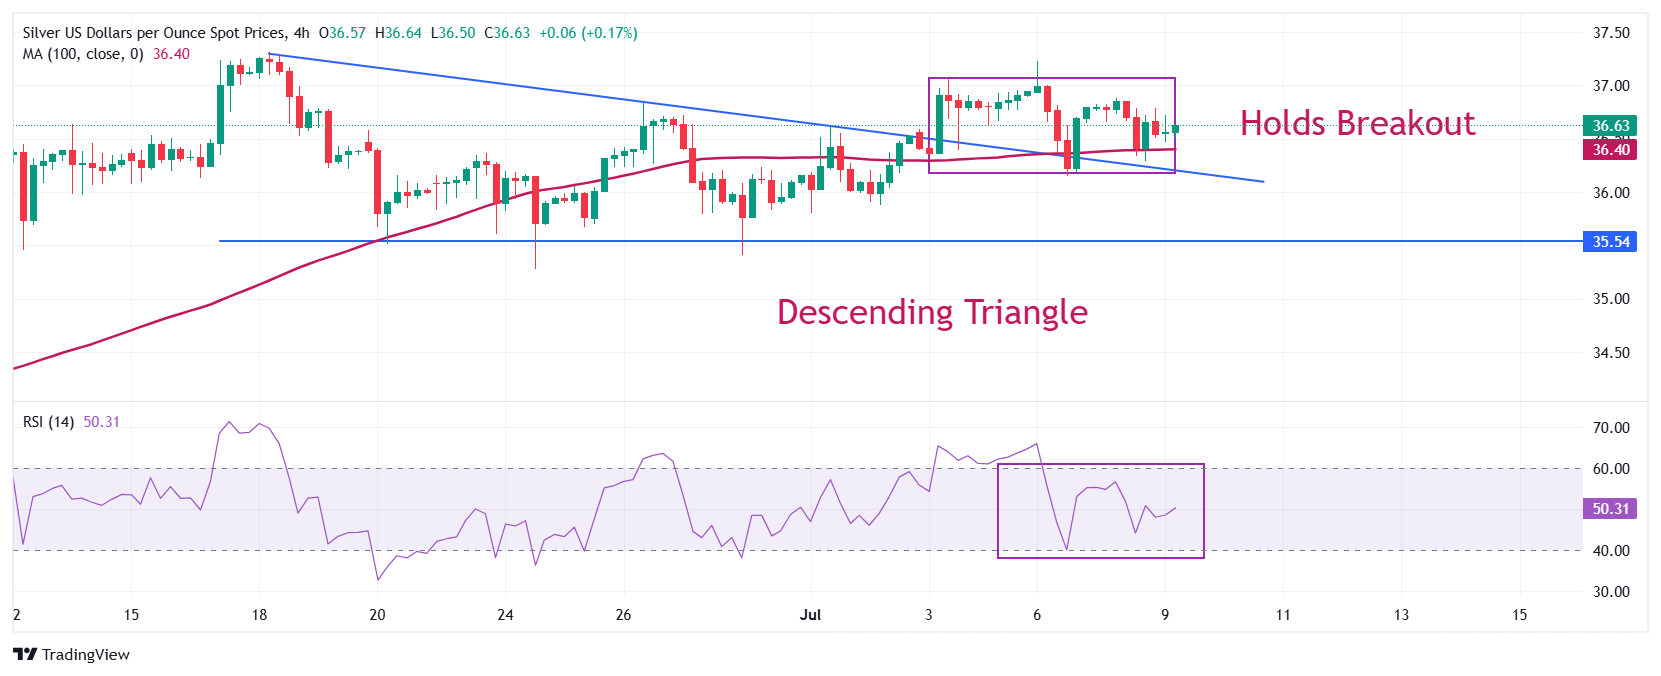
Silver price holds the breakout of the Descending Triangle chart pattern formed on a four-hour time. Theoretically, the breakout of the above-mentioned chart pattern often leads to a volatility expansion, which results in higher volume and wider ticks on the upside.
The downward-sloping trendline of the Descending Triangle formation is plotted from the June 18 high of $37.32, while the horizontal support is marked from the June 20 low of $35.51.
The 14-period Relative Strength Index (RSI) oscillates inside the 40.00-60.00 range, indicating a sideways trend.
Looking down, the March 28 high around $34.60 will act as key support for the Silver price. On the upside, the fresh over-a-decade high around $37.32 will be the key barrier.
Silver four-hour chart
Silver FAQs
Silver is a precious metal highly traded among investors. It has been historically used as a store of value and a medium of exchange. Although less popular than Gold, traders may turn to Silver to diversify their investment portfolio, for its intrinsic value or as a potential hedge during high-inflation periods. Investors can buy physical Silver, in coins or in bars, or trade it through vehicles such as Exchange Traded Funds, which track its price on international markets.
Silver prices can move due to a wide range of factors. Geopolitical instability or fears of a deep recession can make Silver price escalate due to its safe-haven status, although to a lesser extent than Gold's. As a yieldless asset, Silver tends to rise with lower interest rates. Its moves also depend on how the US Dollar (USD) behaves as the asset is priced in dollars (XAG/USD). A strong Dollar tends to keep the price of Silver at bay, whereas a weaker Dollar is likely to propel prices up. Other factors such as investment demand, mining supply – Silver is much more abundant than Gold – and recycling rates can also affect prices.
Silver is widely used in industry, particularly in sectors such as electronics or solar energy, as it has one of the highest electric conductivity of all metals – more than Copper and Gold. A surge in demand can increase prices, while a decline tends to lower them. Dynamics in the US, Chinese and Indian economies can also contribute to price swings: for the US and particularly China, their big industrial sectors use Silver in various processes; in India, consumers’ demand for the precious metal for jewellery also plays a key role in setting prices.
Silver prices tend to follow Gold's moves. When Gold prices rise, Silver typically follows suit, as their status as safe-haven assets is similar. The Gold/Silver ratio, which shows the number of ounces of Silver needed to equal the value of one ounce of Gold, may help to determine the relative valuation between both metals. Some investors may consider a high ratio as an indicator that Silver is undervalued, or Gold is overvalued. On the contrary, a low ratio might suggest that Gold is undervalued relative to Silver.
Author

Sagar Dua
FXStreet
Sagar Dua is associated with the financial markets from his college days. Along with pursuing post-graduation in Commerce in 2014, he started his markets training with chart analysis.


