Silver Price Forecast: XAG/USD consolidates below $32 as investors look for fresh Fed rate cut cues
- Silver price trades sideways below $32.00 as investors seek fresh cues about the Fed’s likely monetary policy action in November and December.
- The US Dollar strengthens after better-than-expected US Retail Sales growth and lower jobless claims.
- Rising US Trump’s odds of winning presidential elections improve the Silver price’s appeal as a safe haven.

Silver price (XAG/USD) trades in a tight range below the key resistance of $32.00 in Thursday’s North American session. The white metal consolidates as investors look for fresh cues about the Federal Reserve’s (Fed) likely interest rate action in the remaining year.
According to the CME FedWatch tool, 30-day Federal Funds futures pricing data shows that the central bank will cut interest rates by 25 basis points (bps) in both policy meetings in November and December.
Meanwhile, upbeat United States (US) monthly Retail Sales and lower Initial Jobless Claims for the week ending October 11 have strengthened the US Dollar (USD). The US Dollar Index (DXY), which tracks the Greenback’s value against six major currencies, posts a fresh 10-month high at 103.85.
The Retail Sales data, a key measure of consumer spending, rose by 0.4%, faster than estimates of 0.3% and the former release of 0.1%. Meanwhile, individuals claiming jobless benefits for the first time came in lower at 241K than estimates of 260K.
10-year US Treasury yields soar to 4.08%. Historically, higher yields on interest-bearing assets increase the opportunity cost of holding an investment in non-yielding assets, such as Silver. However, the Silver price remains supported as growing speculation for former President US Donald Trump winning upcoming presidential elections has improved its appeal as safe-haven.
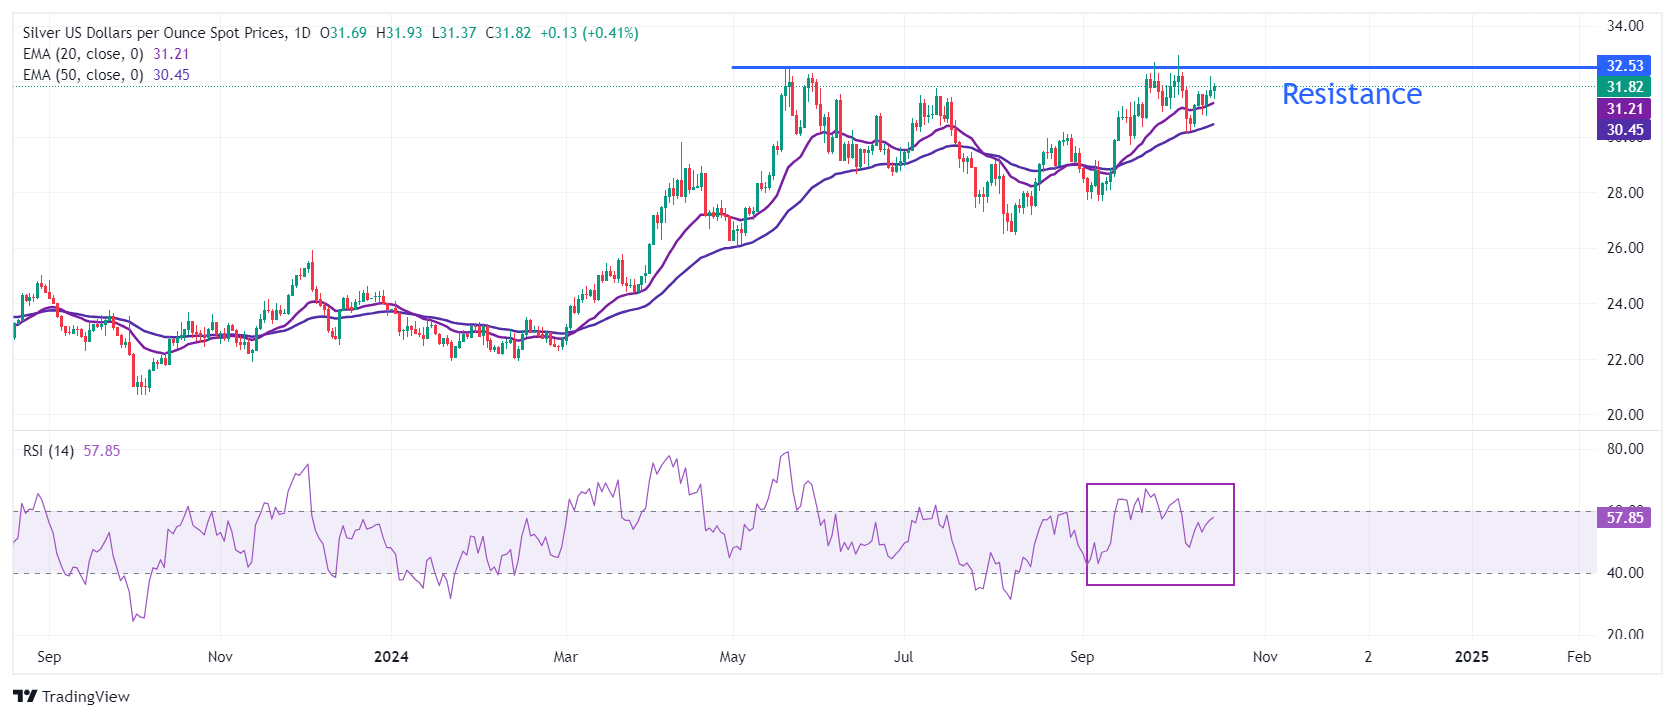
Silver technical analysis
Silver price strives to reclaim the decade-high of $33.00. Upward-sloping 20- and 50- Exponential Moving Averages (EMAs) near $31.20 and $30.45, respectively, suggest a strong uptrend.
The 14-day Relative Strength Index (RSI) approaches 60.00. A decisive break above the same would activate a bullish momentum.
Silver daily chart
Silver FAQs
Silver is a precious metal highly traded among investors. It has been historically used as a store of value and a medium of exchange. Although less popular than Gold, traders may turn to Silver to diversify their investment portfolio, for its intrinsic value or as a potential hedge during high-inflation periods. Investors can buy physical Silver, in coins or in bars, or trade it through vehicles such as Exchange Traded Funds, which track its price on international markets.
Silver prices can move due to a wide range of factors. Geopolitical instability or fears of a deep recession can make Silver price escalate due to its safe-haven status, although to a lesser extent than Gold's. As a yieldless asset, Silver tends to rise with lower interest rates. Its moves also depend on how the US Dollar (USD) behaves as the asset is priced in dollars (XAG/USD). A strong Dollar tends to keep the price of Silver at bay, whereas a weaker Dollar is likely to propel prices up. Other factors such as investment demand, mining supply – Silver is much more abundant than Gold – and recycling rates can also affect prices.
Silver is widely used in industry, particularly in sectors such as electronics or solar energy, as it has one of the highest electric conductivity of all metals – more than Copper and Gold. A surge in demand can increase prices, while a decline tends to lower them. Dynamics in the US, Chinese and Indian economies can also contribute to price swings: for the US and particularly China, their big industrial sectors use Silver in various processes; in India, consumers’ demand for the precious metal for jewellery also plays a key role in setting prices.
Silver prices tend to follow Gold's moves. When Gold prices rise, Silver typically follows suit, as their status as safe-haven assets is similar. The Gold/Silver ratio, which shows the number of ounces of Silver needed to equal the value of one ounce of Gold, may help to determine the relative valuation between both metals. Some investors may consider a high ratio as an indicator that Silver is undervalued, or Gold is overvalued. On the contrary, a low ratio might suggest that Gold is undervalued relative to Silver.
Author

Sagar Dua
FXStreet
Sagar Dua is associated with the financial markets from his college days. Along with pursuing post-graduation in Commerce in 2014, he started his markets training with chart analysis.


