Silver Price Forecast: XAG/USD bulls await move beyond $31.70-$31.75 horizontal barrier
- Silver climbs back closer to over a one-month high retested the previous day.
- The technical setup favors bulls and supports prospects for additional gains.
- Any meaningful corrective slide might now be seen as a buying opportunity.

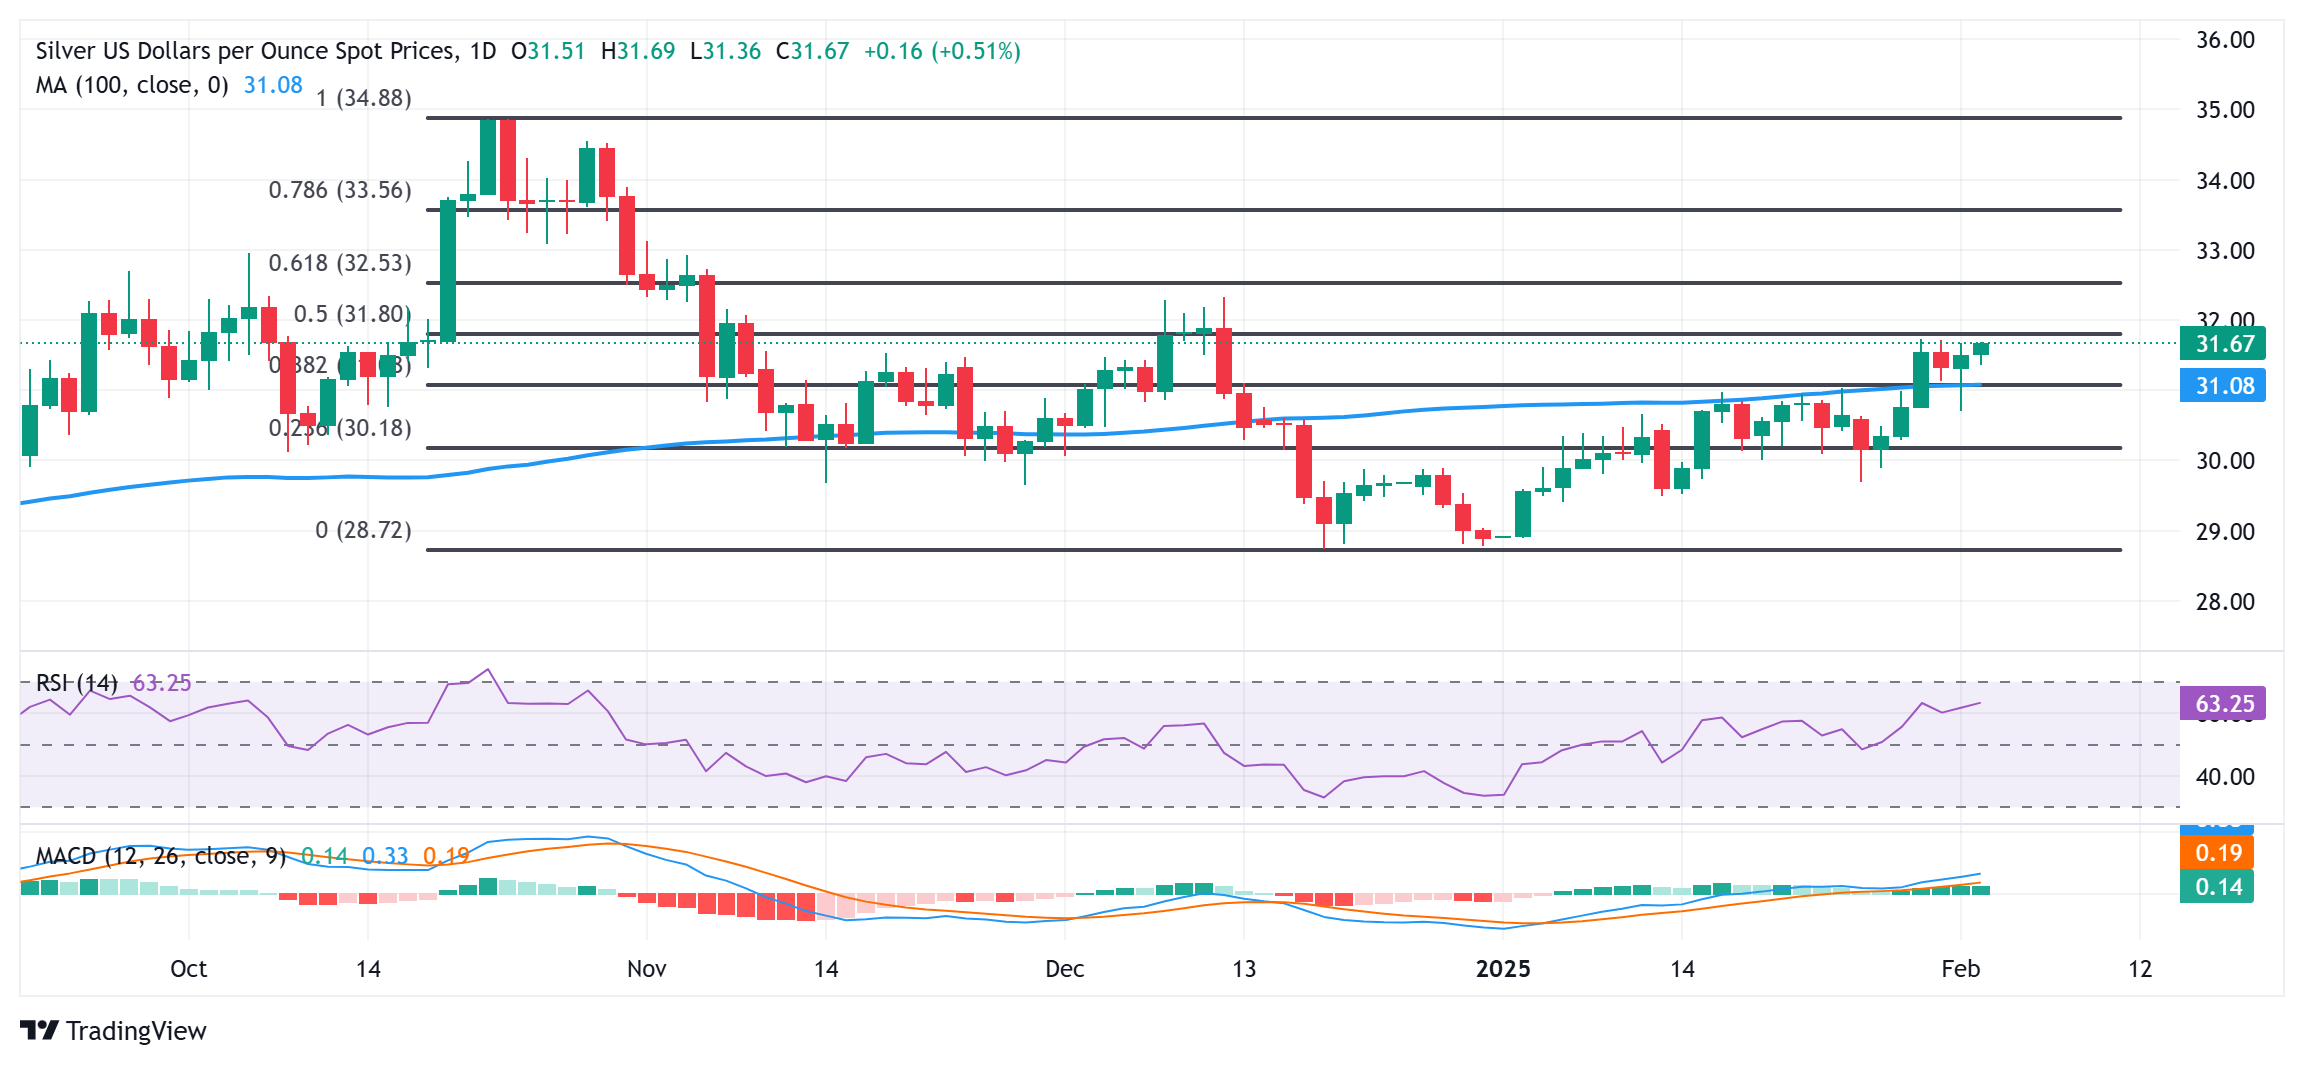
Silver (XAG/USD) attracts buyers for the second straight day on Tuesday and sticks to its positive bias, above mid-$31.00s through the first half of the European session. The white metal, however, lacks follow-through and remains below the $31.70-$31.75 barrier, or its highest level since December 12 retested on Monday.
From a technical perspective, last week's breakout through the $31.00 confluence – comprising the 38.2% Fibonacci retracement level of the October-December fall and the 100-day Simple Moving Average (SMA) – was seen as a key trigger for bulls. Apart from this, oscillators on the daily chart have been gaining positive traction and suggest that the path of least resistance for the XAG/USD is to the upside.
That said, it will still be prudent to wait for some follow-through buying beyond the $31.70-$31.75 immediate resistance before positioning for any further gains. The XAG/USD might then aim to surpass the $32.00 mark and test the next relevant hurdle near the $32.30-$32.40 area, nearing the 61.8% Fibo. level. The momentum could extend further towards reclaiming the $33.00 round-figure mark.
On the flip side, the $31.10-$31.00 confluence resistance breakpoint now seems to protect the immediate downside, below which the XAG/USD could accelerate slide further towards the $30.25 support zone. This is followed by the $30.00 psychological mark. A convincing break below the latter might prompt aggressive technical selling and drag the white metal to the $29.55 region en route to the $29.00 mark.
Silver daily chart
Silver FAQs
Silver is a precious metal highly traded among investors. It has been historically used as a store of value and a medium of exchange. Although less popular than Gold, traders may turn to Silver to diversify their investment portfolio, for its intrinsic value or as a potential hedge during high-inflation periods. Investors can buy physical Silver, in coins or in bars, or trade it through vehicles such as Exchange Traded Funds, which track its price on international markets.
Silver prices can move due to a wide range of factors. Geopolitical instability or fears of a deep recession can make Silver price escalate due to its safe-haven status, although to a lesser extent than Gold's. As a yieldless asset, Silver tends to rise with lower interest rates. Its moves also depend on how the US Dollar (USD) behaves as the asset is priced in dollars (XAG/USD). A strong Dollar tends to keep the price of Silver at bay, whereas a weaker Dollar is likely to propel prices up. Other factors such as investment demand, mining supply – Silver is much more abundant than Gold – and recycling rates can also affect prices.
Silver is widely used in industry, particularly in sectors such as electronics or solar energy, as it has one of the highest electric conductivity of all metals – more than Copper and Gold. A surge in demand can increase prices, while a decline tends to lower them. Dynamics in the US, Chinese and Indian economies can also contribute to price swings: for the US and particularly China, their big industrial sectors use Silver in various processes; in India, consumers’ demand for the precious metal for jewellery also plays a key role in setting prices.
Silver prices tend to follow Gold's moves. When Gold prices rise, Silver typically follows suit, as their status as safe-haven assets is similar. The Gold/Silver ratio, which shows the number of ounces of Silver needed to equal the value of one ounce of Gold, may help to determine the relative valuation between both metals. Some investors may consider a high ratio as an indicator that Silver is undervalued, or Gold is overvalued. On the contrary, a low ratio might suggest that Gold is undervalued relative to Silver.
Author

Haresh Menghani
FXStreet
Haresh Menghani is a detail-oriented professional with 10+ years of extensive experience in analysing the global financial markets.


