Silver Price Forecast: XAG/USD approaches two-week high of $28.80 with eyes on US Inflation data
- Silver price rises toward two-week high of $28.80 as US Dollar edges down.
- The US Dollar drops even though US PPI grew at a faster rate in April.
- The Fed could delay rate cuts beyond September.

Silver price (XAG/USD) jumps higher to $28.60 in Tuesday’s New York session. The white metal strengthens as the US Dollar drops despite the United States Bureau of Labor Statistics (BLS) has published a stubborn Producer Price Index (PPI) report.
Monthly headline PPI grew at a faster rate of 0.5% from the estimates of 0.3%, suggesting price pressures remained persistent at the start of the second quarter. The Core PPI that excludes volatile food and energy prices also rose by 0.5%. Annual headline and the core PPI data grew in line with estimates of 2.2% and 2.4%.
This has deepened fears about the Federal Reserve (Fed) delaying rate cuts beyond September or keeping interest rates in their current range of 5.25%-5.50% for the entire year. The US Dollar Index (DXY), which tracks the US Dollar’s value against six major currencies, falls to 105.00. The appeal for dollar-denominated Silver improves when the Greenback edges down.
10-year US Treasury yields fall further to 4.46%. Generally, deepening risks of persistent inflation boost yields on interest-bearish assets. However, in this case, bond yields have fallen. This has diminished the opportunity cost of holding an investment in non-yielding assets, such as Silver.
This week, the US Consumer Price Index (CPI) data for April will be the major economic indication that will help investors to project the next move in the Silver price, US Dollar and the bond yields, which will be published on Wednesday. Investors will also focus on the monthly Retail Sales, which will be published along with the consumer inflation data.
Silver technical analysis
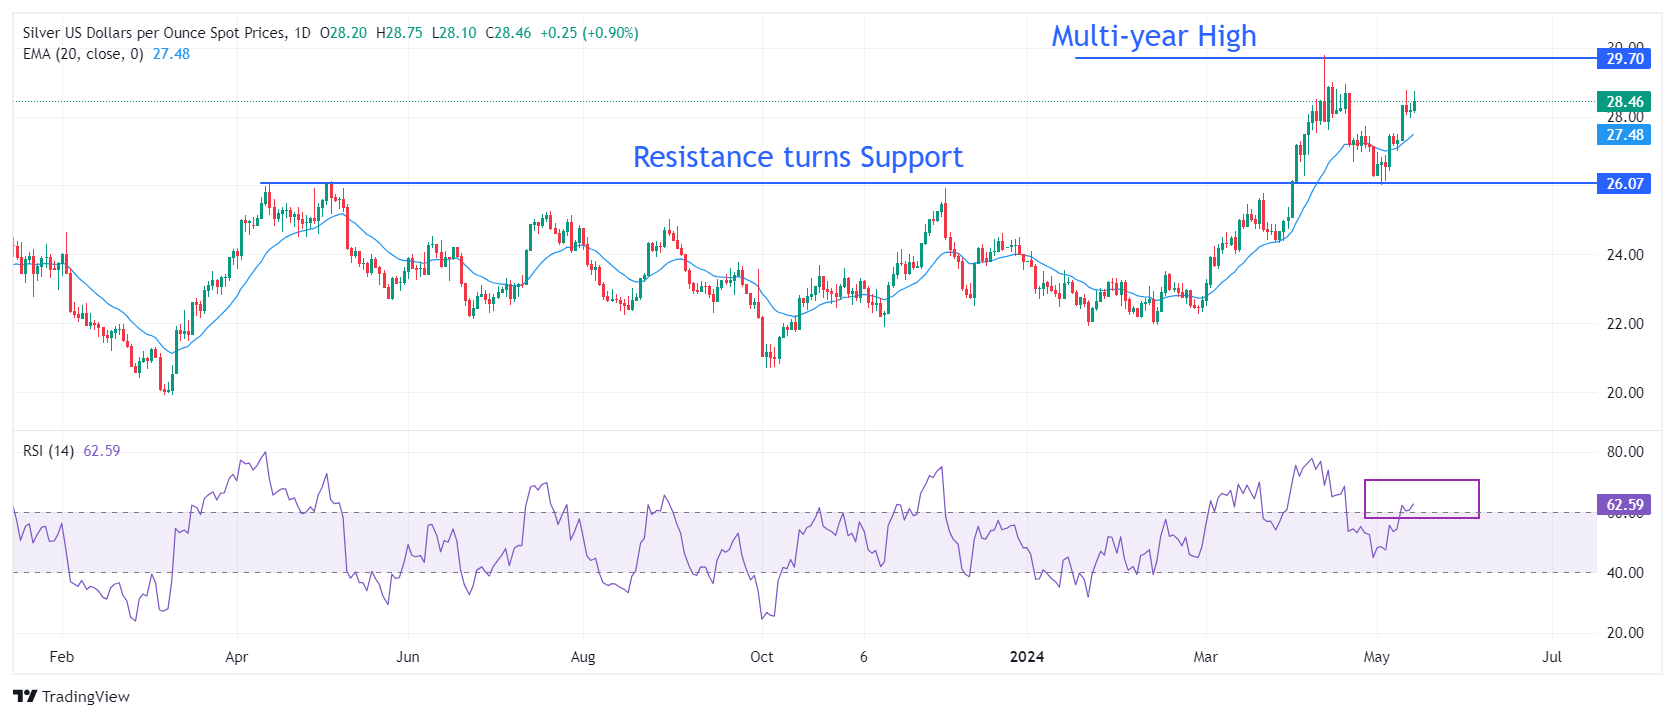
Silver price recovers sharply after discovering buying interest near the horizontal support plotted from 14 April 2023 high around $26.09 on a daily timeframe. The above-mentioned support was earlier a major resistance for the Silver price bulls. The white metal is approaching the multi-year high at $29.80.
The near-term outlook of Silver has improved as it returns above the 20-period Exponential Moving Average (EMA), which trades around $27.30.
The 14-period Relative Strength Index (RSI) shifts into the bullish range of 60.00-80.00, suggesting that a bullish momentum has been triggered.
Silver daily chart
Author

Sagar Dua
FXStreet
Sagar Dua is associated with the financial markets from his college days. Along with pursuing post-graduation in Commerce in 2014, he started his markets training with chart analysis.


